
How should we recapture consumer demand in the post-lockdown period? Which stores should we reopen? Where should we invest in marketing?
Businesses make millions of decisions in response to these and many other questions every week. Cumulatively, their decisions will affect both the shape of the rebound and help determine the winners and losers within it.
At BCG, we constantly encounter questions like the ones above as we advise our clients. Unfortunately, traditional time-series-based customer demand forecasting is impractical in this unprecedented environment. So instead, companies are turning to an array of high-frequency indicators that, taken together and integrated with their internal data, provide the latest pulse on where demand and supply are headed.
In this week’s snapshot, we look beyond consumer sentiment to other data sources, leading indicators, and models, and we explore how they, in combination with sentiment, can deliver powerful insights that are critical to creating advantage in the COVID-19 recovery and the new reality.
Read the other COVID-19 Consumer Sentiment Snapshots
Lasting Impact: August 2021
Opening Closed Doors: May 2021
Snapshot Key Charts: November
Snapshot Key Charts: September
Snapshot Key Charts: August
Snapshot Key Charts: July
Snapshot Key Charts: June
Snapshot #13 | OCTOBER 19, 2020 | Picking a POTUS
Snapshot #12 | JUNE 08, 2020 | The Pace Car
Snapshot #11 | JUNE 02, 2020 | Getting to the Other Side
Snapshot #10 | MAY 18, 2020 | The Trip Back
Snapshot #9 | MAY 11, 2020 | A Lighthouse to Navigate the New Reality
Snapshot #8 | MAY 04, 2020 | A Glimpse of the Horizon
Snapshot #7 | APRIL 27, 2020 | Retracing the Old Normal
Snapshot #6 | APRIL 20, 2020 | Hitting the Straightaway
Snapshot #5 | APRIL 13, 2020 | A Story for the Ages
Snapshot #4 | APRIL 06, 2020 | Fighting in the Dark
Snapshot #3 | MARCH 30, 2020 | Turning the Tide
Snapshot #2 | MARCH 23, 2020 | Racing the Clock
Snapshot #1 | MARCH 17, 2020 | Setting the Baseline
Special Feature Articles
COVID-19 Consumer Sentiment Snapshot: Special Feature—Asia-Pacific
How Marketers Can Win with Gen Z and Millennials Post-COVID-19
A Note on Our Approach: A Lighthouse to Navigate the New Reality
Our team of data scientists, engineers, and consultants has built an AI platform for decision support and scenario planning during COVID-19 that we call BCG Lighthouse—and we used it to develop the insights that appear in this article. By bringing together epidemiological models, consumer data (credit card spend, mobility, sentiment, and the like), micro- and macroeconomic indicators (such as unemployment claims, job listings, and government measures), information on health care system capacity, and digital leading indicators (web traffic, search, and social media trends), the BCG Lighthouse platform gives companies a foundation for building simple, rapid decision-making dashboards to help them make tough choices. Although this platform does not obviate the need to build custom solutions to deal with a company’s specific situation, it can dramatically shorten the time needed to design and build them. Most importantly, it enables leaders and teams to quickly act on data-driven analytical insights rather than relying on gut-based decisions in the face of tremendous uncertainty or delaying decisions altogether.
The capability is most powerful when it incorporates data from a broad range of parameters. But trying to make sense of so many signals can be a disconcerting challenge for leaders who must rapidly make important decisions. In our experience, it is important to arm executives not only with the right customized dashboards but also with a go-to recovery index that captures a multiplicity of data in a single easy-to-understand number that they can compare across markets at a granular level. With this in mind, we have developed the Consumer Activity Index (CAI), which captures underlying trends in consumer mobility and spending data, along with economic indicators such as unemployment, in a single metric available by geography (down to the county or market level). Businesses can use this score to decide which markets to focus on when allocating inventory, reopening stores, or investing scarce dollars in media and promotions.
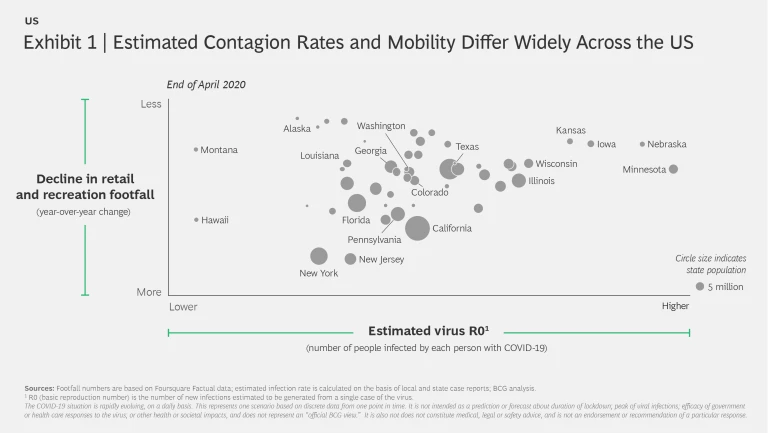
At the same time, businesses need to consider underlying trends and build a de-averaged understanding of the data. On-the-ground trends differ widely across geographies. (See Exhibit 1.) Some states (such as New York and New Jersey) have seen recent levels of footfall traffic drop by close to two-thirds, while mobility in others (such as Alaska, Kansas, and Iowa) is close to what it was last year. Another important variable is the virus contagion rate—a measure of how many other people each COVID-19-infected person is likely to infect. In some states, this rate is twice as high as it is in others. Monitoring these types of real-time trends can enable companies to consider an appropriate range of scenarios regarding how consumer activity could evolve in specific geographies.
Insights from the Lighthouse
Working with the BCG Lighthouse platform, we have performed a number of deep dives in specific areas of the economy. In each case, these efforts have yielded illuminating insights. In this article, we will focus on inquiries into five such areas: grocery retailers, restaurants, travel, automotive, and fashion retailers.
Grocery Retailers
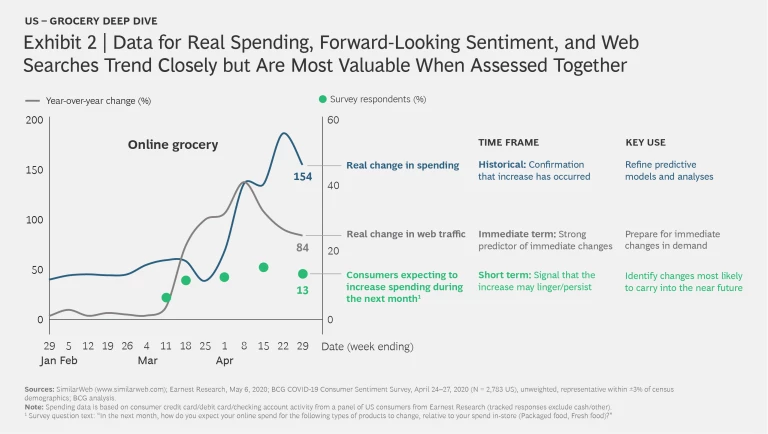
In our work with grocery retailers and consumer goods manufacturers, we have found that monitoring changes in credit card spending, stated intention to spend, and changes in web traffic and online search trends, when done in combination, can shed light on the leading indicators of demand. (See Exhibit 2.) Changes in web traffic and searches presage spending trends by a week or so, and sentiment signals can help researchers understand the extent to which these changes are likely extend beyond that period.
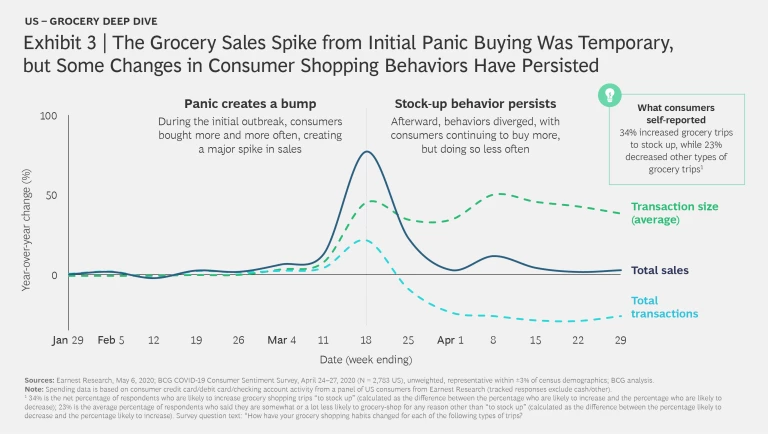
As the example of consumer behavior in the retail grocery segment shows, looking at overall sales trends is not sufficient. After a massive spike, overall grocery sales in many markets have reverted to levels seen earlier in the year. (See Exhibit 3.) Underlying that trend, however, is the fact that consumers have significantly cut back on the number of trips they make, likely to avoid frequent interactions with others due to COVID-19, but have increased the total transaction size for each trip. For grocers, this change in consumer behavior has profound implications for assortment decisions, and it raises new challenges for the marketers of impulse add-on items.
De-averaging trends is an important analytical step—in the retail grocery business and in other consumer-focused industry segments as well.
Restaurants
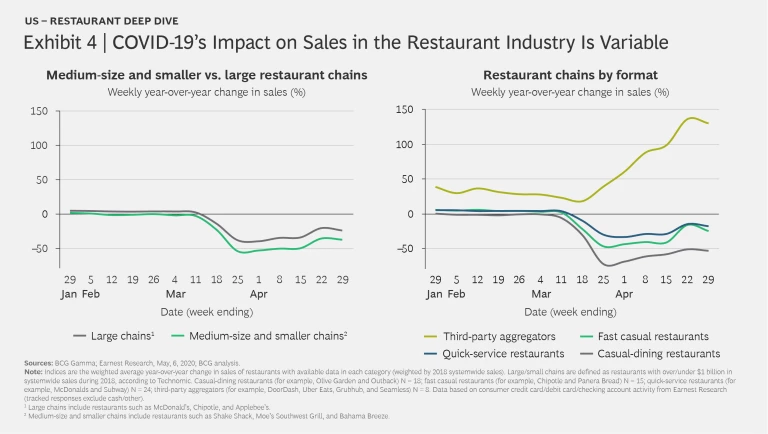
Following an initial period of sharply declining sales across the US restaurant industry, as a result of lockdowns, declines now appear to be leveling off. Nevertheless, we see significant variation in performance across the industry: quick-service (that is, fast-food) restaurants are performing better than average, and casual-dining restaurants are performing worse than average—no surprise, given that dine-in has been shut down. (See Exhibit 4.) In terms of specific cuisines, pizza chains are enjoying growth of 13%, while sales at cafés and family-style restaurants are down 55% to 75%. Third-party delivery aggregators, such as DoorDash, Uber Eats, GrubHub, and Seamless, have substantially exceeded their baseline growth, as many restaurants now rely on them to reach customers at home. Going forward, restaurants must secure their top line with rapid changes in their menu offering and must innovate new channel and service options to meet changing customer needs.
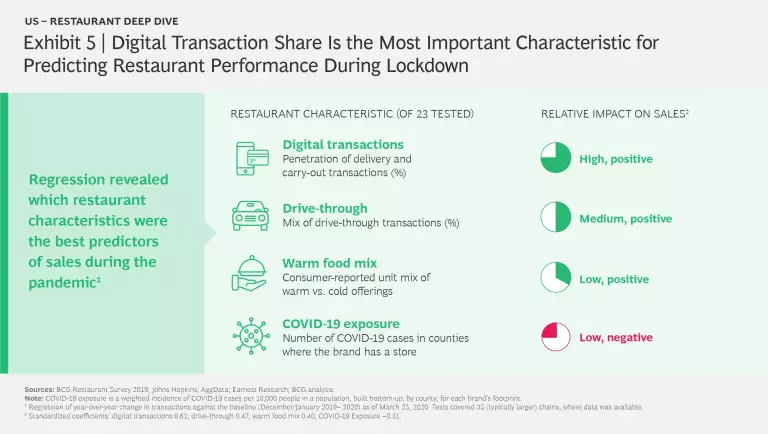
Many companies were already advancing their digital agendas, and the quick shift to lockdown during the recent crisis has highlighted the importance of moving quickly—particularly in the restaurant industry. We conducted a regression across 35 large restaurant chains and 23 factors to understand what was driving differences in recent performance across brands: Digital transaction penetration was the single most important predictor of stronger performance during the crisis—and was nearly twice as important as the COVID-19 exposure variable. (See Exhibit 5.) Companies that accelerated their digital and off-premises agenda before the crisis are being rewarded. It is increasingly important for restaurants to accelerate their digital demand generation and encourage customers to develop sticky habits during the crisis that will benefit them in the subsequent recovery.
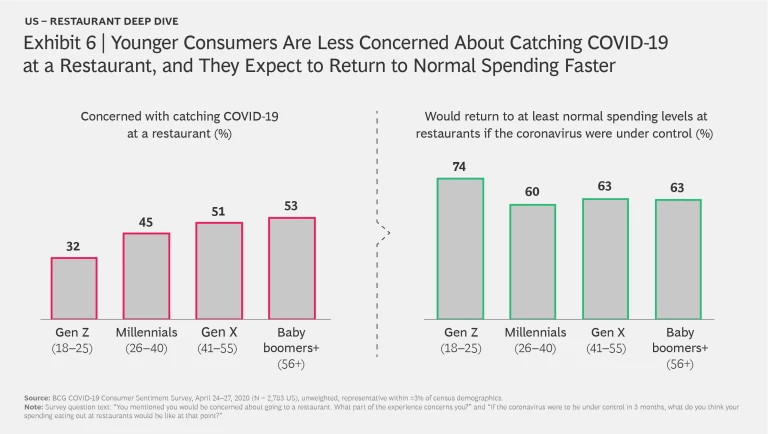
Consumer sentiment data indicates that restaurants oriented toward younger audiences are likely to recover more speedily, given that Gen-Zers are the cohort least concerned about catching the virus at a restaurant, and given that a substantial majority (74%) of them believe that they will revert to their normal spending levels at restaurants once the virus is under control. (See Exhibit 6.)
Travel
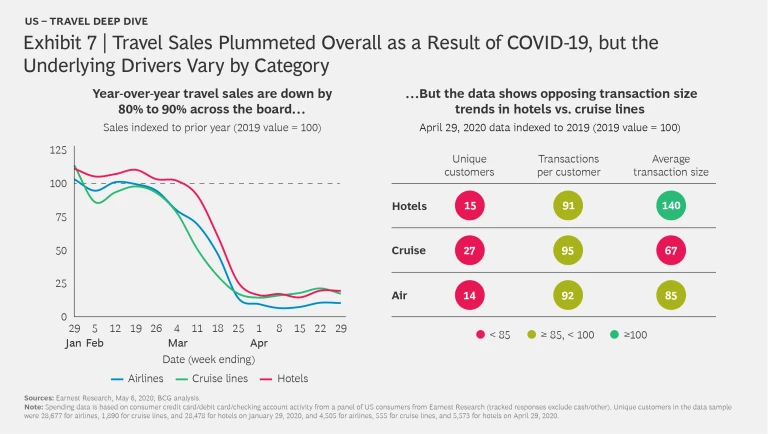
The travel sector is currently enduring dark days because of COVID-19. In terms of overall weekly sales based on credit card spending (which reflects future bookings), the results for airlines, cruise lines, and hotels look quite similar, with total sales plummeting 80% to 90% across all three. In reality, however, each industry is feeling different effects. For example, hotels experienced a bigger decline in number of unique customers —down to just 15% of what it was in 2019—than did cruise lines, which retained 27% of their 2019 baseline. However, hotels actually saw a year-over-year increase in average transaction size to 140%, while cruises suffered a decline to 67% of last year’s average transaction size. In combination, these factors’ impact on total sales looks similar despite the disparity in their underlying drivers. (See Exhibit 7.)
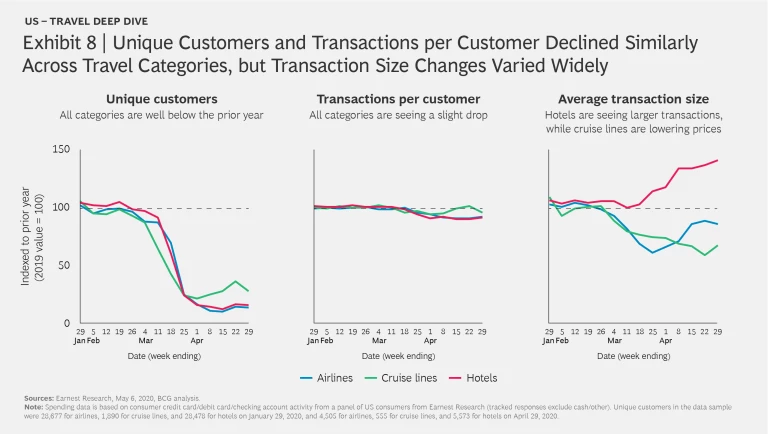
The path toward recovery will probably also look a bit different for each of these sectors. For example, the trend line for hotels suggests that they may be able to rely more on transaction size, at least initially, while cruises may be starting to see a recovery in unique customers. (See Exhibit 8.) It is important to note, however, that most companies in the sector currently permit fully refundable credit card bookings, meaning that consumers may be booking today across the airline, hotel, and cruise subsectors in the hope that they will feel comfortable traveling at the planned trip date; but what the follow-through on bookings will look like as we head out of lockdown remains to be seen. Undoubtedly the state of the coronavirus itself will strongly influence consumers’ ultimate decisions about leisure travel.
Automotive
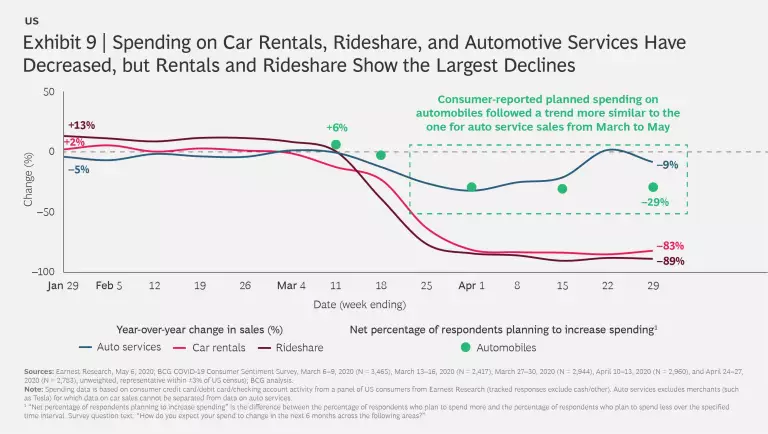
The automotive sector, too, has experienced an overall decline in sales, but the size of that decline differs significantly from one subsector to another. (See Exhibit 9.) For example, we see car rentals and rideshare suffering year-over-year declines of more than 80%, likely because of consumers’ concern about catching the virus from these sources; in our April 24–27 survey, 32% of consumers reported having such concerns about rideshare.
Fashion Retailers
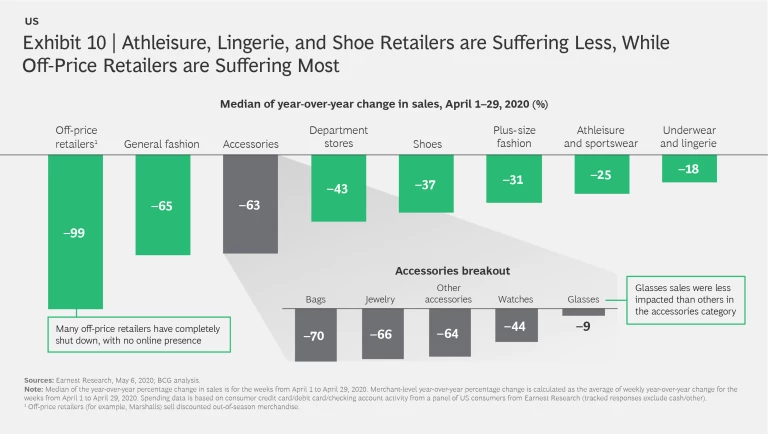
The crisis has also heavily hit apparel and department stores. The precise impact varies significantly by category, however, with sales of essential accessories such as glasses down less than 10% in April, thanks to healthy online sales, while sales of luxury items such as handbags and jewelry are down by two-thirds or more. (See Exhibit 10.) Despite the severe overall declines, the new shape of consumption offers opportunities for brands in categories such as athleisure to find and serve pockets of demand among consumers who are spending significantly more time at home.
What Trends Will Prove to Be Long-Lasting?
It is instructive to map long-term category trends against short-term COVID-19 impacts. (See Exhibit 11.) The current crisis has accelerated trends that were already underway, such as the rise of Amazon and of organic foods and the decline of department stores. Before the crisis, the biggest barrier to increased penetration in online grocery shopping was consumer diffidence about giving it a try: consumers who shopped for groceries online once were highly likely to do so again. Because the pandemic has forced a large portion of the population to take the plunge in ordering groceries online for the first time, it has enabled the segment to skip years ahead in the pending channel mix shift.
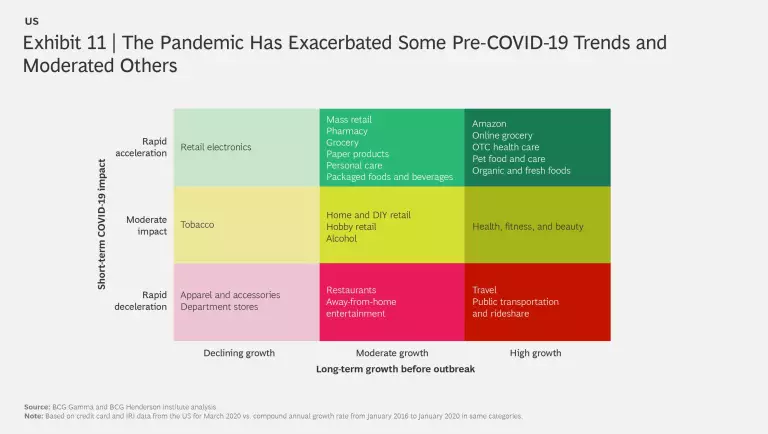
But COVID-19 has interrupted and hampered other trends, such as the ongoing shift toward rideshare. Some of these shifts will prove to be temporary blips while others may yield lasting effects. For example, if consumers’ fear of catching the virus through rideshare fades as the spread of new cases of the virus diminishes, the majority of consumers are likely to resume rideshare, but a portion may in the meantime become accustomed to driving their own cars and may find the experience more satisfying for some or all trips. In still other areas, tectonic shifts in consumer habits may be underway. Faced with mandated gym closures, consumers have found ways to engage with their trainers in community workouts on YouTube and through online yoga classes. Some of them have invested in home gyms or tried new sports such as running for the first time, and some of these behaviors may prove sticky.
Looking Ahead
As we look toward recovery, we think it is imperative that clients take the time now to develop a lighthouse of demand indicators to inform their scenario modeling and business decisions—one that leverages high-frequency data and future predictors rather than following the prior practice of focusing on historical results as the best predictor of the future. Historical results will not be sufficient in such a disrupted world, and one where advanced, data-science techniques are available. Moreover, during major crises—especially ones of extended duration versus single-event shocks—consumer behaviors and needs may change in the short or longer term. Whether the changes in demand reflect newfound drivers of choice (for example, sanitation and hygiene emerging as critical decision criteria and potential differentiators), meaningful pivots in lifestyles and habits (for example, potlucks at home replacing Friday night dinners out), or major shifts in supply (depending on what businesses survive this challenging time), both the size and the shape of demand are likely to look quite different throughout the recovery and beyond. Only by continuously monitoring a wide variety of high-frequency indicators to bring insights to light and by rapidly adjusting their decisions on the basis of what they learn will companies be able to successfully navigate the new reality.
Our next Snapshot will look at current and potentially persistent consumer sentiment and spending shifts in the travel and tourism sector, including airlines, hotels, cruise lines, and gaming—arguably the sector that COVID-19 has most negatively affected.
About BCG Lighthouse
BCG Lighthouse is an AI platform that enables rapid decision-making on the basis of short-term sensing of high-frequency indicators and medium-term scenario planning. It integrates real-time consumer and market-level data with BCG’s proprietary models and company-specific internal data. Data and models include Consumer Activity Index (CAI), epidemiological models, online and mobile behavior (web traffic, search, social media trends, and footfall) and consumer data (for example, sentiment, credit card spending, and unemployment data). Data sources are available for 180 countries.
About the Research
BCG’s COVID-19 Consumer Sentiment Snapshot series is based on data drawn from an online survey of consumers that is conducted every one to two weeks across multiple countries worldwide. Each Snapshot highlights a selection of insights from a comprehensive ongoing study that BCG provides to clients. The survey is produced by the authors, who are members of BCG’s Center for Customer Insight (CCI), in partnership with coding and sampling provider Dynata, the world’s largest first-party data and insights platform. The goal of the research is to provide our clients and businesses around the world with periodic barometer readings of COVID-19-related consumer sentiment and actual and anticipated consumer behavior and spending to inform critical crisis triage activities, as well as rebound planning and decision making. The research does not prompt consumers about the virus when asking many of the key questions, including questions about spending changes in the next six months, in order to avoid biasing the results. A team composed of BCG consultants and experts from CCI completes the survey analytics.
Legal Context
The situation surrounding COVID-19 is dynamic and rapidly evolving, on a daily basis. This COVID-19 research is not intended to: (i) constitute medical or safety advice, nor be a substitute for the same; nor (ii) be seen as a formal endorsement or recommendation of a particular response. As such you are advised to make your own assessment as to the appropriate course of action to take.
Acknowledgments
We would like to thank our key contributors for this article:
- Global and US consumer sentiment team: Dan Metzel, Andrea Mendoza, Madeleine Macks, Ariel Hudes, Christian Ueland, Lolly Buenaventura, Thomas Uhler, and Ian Irungu
- BCG Lighthouse platform and solutions team: Aaron Arnoldsen, Reed Jessen, Sebastien Bak, Tania Wang, Adam Whybrew, Steve Mills, Alex Duerloo, David Galley, CJ Gasper, Sarah Eade, Wenxi Lei, Gaurav Singh, Leah Perri, Kim Kennewell, Judith Diedericks, Vincent Faber, Daniele Parenti, Paula Vich, Giuseppe Tallini, Roelant Kalthof, Simon Miller, Allen Chen, Michael Chu, Bjoern Brings, Ujjwal Sinha, Diederik Vismans, Nick Goad, Nicolas de Bellefonds, Mark Abraham, Sylvain Duranton and many others
- Restaurant team: Dylan Bolden, TR Geng, Lee Robertson, Amanda Luther, Mary Martin, Louise Wiggins, Ben Eppler, Jon Roberts, Steven Strott, and Bensey Davidson.
We appreciate the generous support that the following people have provided in producing COVID-19 research and the associated article series:
- Practice leadership: Rohan Sajdeh, Jean-Manuel Izaret, Sylvain Duranton, Niki Lang, Nicolas de Bellefonds, Jason Guggenheim, Pranay Jhunjhunwala, Nimisha Jain, and Stephane Cairole
- Knowledge team: Kelsey Almaguer, Elena Loridas, Kosmo Karantonis, Anna Upyr, and Deepti Tyagi
We also thank BCG’s Center for Customer Insight (CCI) team globally, Scott Wallace, and Dynata.
About BCG’s Center for Customer Insight (CCI)
Boston Consulting Group’s Center for Customer Insight (CCI) applies a unique, integrated approach that combines quantitative and qualitative consumer research with a deep understanding of business strategy and competitive dynamics. The center works closely with BCG’s various practices to translate its insights into actionable strategies that lead to tangible economic impact for our clients. In the course of its work, the center has amassed a rich set of proprietary data on consumers from around the world, in both emerging and developed markets. The CCI is sponsored by BCG’s Marketing, Sales & Pricing practice and Global Advantage practice. For more information, please visit Center for Customer Insight.
About Dynata
Dynata is the world’s largest first-party data and insights platform. With a reach that encompasses 62 million consumers and business professionals globally, and an extensive library of individual profile attributes collected through surveys, Dynata is the cornerstone for precise, trustworthy quality data. The company has built innovative data services and solutions around its robust first-party data offering to bring the voice of the customer to the entire marketing continuum—from strategy, innovation, and branding to advertising, measurement, and optimization. Dynata serves nearly 6,000 market research, media and advertising agencies, publishers, consulting and investment firms and corporate customers in North America, South America, Europe, and Asia-Pacific. Learn more at www.dynata.com.


