
By now it’s clear that electric vehicles (EVs) offer drivers a variety of benefits—and many countries, including the US and nearly all EU member states, offer incentives for EV adoption. Then why are so few drivers trading in their gas-powered cars for EVs?
One key factor is range anxiety—drivers’ concerns that they may be stranded without power if they travel a long distance and can’t locate a charging station. Another issue is their limited understanding of how the EV charging process might affect their everyday lives. We believe that driver perceptions about the time and effort required to charge an EV, compared to fueling an internal combustion engine (ICE) vehicle, is one of the most important factors preventing people from making the switch.
The Auto AI team at BCG recently conducted an innovative simulation to determine the additional time and effort ICE drivers will experience when switching to an EV. Drawing on an extensive body of driver and EV charging data, we were able to identify the groups of ICE vehicle owners with a higher degree of readiness to switch. The insights from this process can help automakers target prospective EV customers and can inform EV infrastructure planners working to optimize the public charging experience.
Our Framework for Analysis: A Few (Million) Car Trips in Texas
The team’s analysis was based on data purchased from a leading provider of connected car information. It represents 15 million trips made by 10,000 connected passenger vehicles throughout Texas—one of the largest US states with a robust mix of urban, metropolitan, suburban, and rural areas.
Using the simulations to generate patterns from the data, we segmented drivers into six archetypes to identify their driving behaviors and needs—especially in terms of EV distance range and access to public charging networks. Our simulations highlight different combinations of charging network improvements in terms of density and speed and how these factors impact EV readiness of the archetypes. For example, drivers who make frequent, extended round trips benefit more from improvements in network speed because they must charge their cars when enroute. (See “Study Methodology and Assumptions” for more information.)
Study Methodology and Assumptions
Study Methodology and Assumptions
EV Distance Range Assumptions
- EV distance ranges noted in the article refer to the official ranges determined by the US Environmental Protection Agency (EPA).
- Our simulations are based on the effective range of the vehicle. This figure is about 30% lower than the EPA ranges to take into consideration the fact that the battery is charged only partially, as well as the impact of weather conditions and driving behavior.
- The simulations were implemented with the highest level of granularity, considering the speed and temperature of every trip in the sample. In the sample, 40% of the total distance has been run at outside temperatures higher than 35 C° or lower than 15 C°, with temperature control consuming additional battery power. Speed calculations yield similar results: 40% of the total distance has been run at a speed higher than 70 km/h.
EV Readiness Simulation Assumptions: Technology
- The simulation models a driver switch from an ICE vehicle to an EV with a 70 kWh battery, 500 km EPA range, and 14 kWh/100km efficiency (similar to the Tesla Model 3).
- Type 2 chargers, which comprise 80% of the network in the sample, are assumed to have a charging speed in Texas of 12 k/W. The remaining 20% are fast-charging Type 3 stations, like Tesla SuperChargers.
- Time spent waiting to use a charger at public charging stations is assumed to be negligible, reflecting low levels of EV penetration.
EV Readiness Simulation Assumptions: Demographics and Behaviors
- Based on US Census data, we assumed that 35% of people in high-density areas live in single-family homes and 80% of people in mid-low density areas live in single-family homes.
- By upgrading personal garages and parking lots, 85% of single-family home households and 25% of apartment households can install home charging systems.
- Drivers are willing to proactively recharge their cars at destination-related locations if the charging station is less than 500 m away.
- Drivers will walk between charging stations and their final destinations at a speed of roughly 5 km/h.
- Where charging stations are integrated with micro-mobility, drivers will be willing to travel 2 km to a charging station, at a speed of 15 km/h.
- Workplace charging stations are defined as non-home locations where a car is parked for more than 4.5 hours for at least 100 weekdays per year.
Time and Effort: The Keys to Driver Readiness
Compared to filling up the tank of an ICE vehicle at the local gas station, charging an EV takes more time—and charging networks are not as widely available. Therefore, EV owners benefit from charging at destinations where they typically leave the car for extended periods, such as at home, work, or parking lots and garages.
For our simulation, we estimated the additional time and effort it takes to charge an EV, considering actual driving patterns and circumstances. We incorporated the distance to the charging point closest to each driver’s destination, the charging speed for that point, the time it takes to charge a car, and the need to interrupt a trip and wait for the charge. We also evaluated the impact of local weather conditions on EV range, as heating and cooling a car’s interior can significantly reduce battery duration.
Our core assumption for determining EV readiness is that drivers are ready to switch to an EV if the additional time and effort (net time over the time spent fueling an ICE) is under 5% of the total time spent driving. For the drivers within our dataset, who drive an average of 11 hours per week, the five percent threshold translates to about 30 minutes.
Charging Location Underlies the Time+Effort Factor
Our simulations were conducted under two scenarios. The public charging scenario applies to drivers who can only charge their EVs in publicly accessible stations, such as those in a shopping center or highway rest stop. In the private scenario, drivers can charge their cars at home, and only need public chargers on extended trips. (Note that the ability to charge an EV at work is not included in the simulations.)
In simulations under the public charging scenario, only 3% of drivers are EV ready, even with a relatively high-range (500 km) electric vehicle. (We used 500 km as the base vehicle range as it is similar to the range of the Tesla Model 3, a top seller in the US.) When the simulations are set to the private, at-home charging scenario, the percentage of EV-ready drivers jumps to 71%—again, assuming people own 500 km range EVs. Dropping the EV range to 300 km, our simulations still find that over 50% of private-charging drivers are ready to switch from an ICE. (See Exhibit 1.)
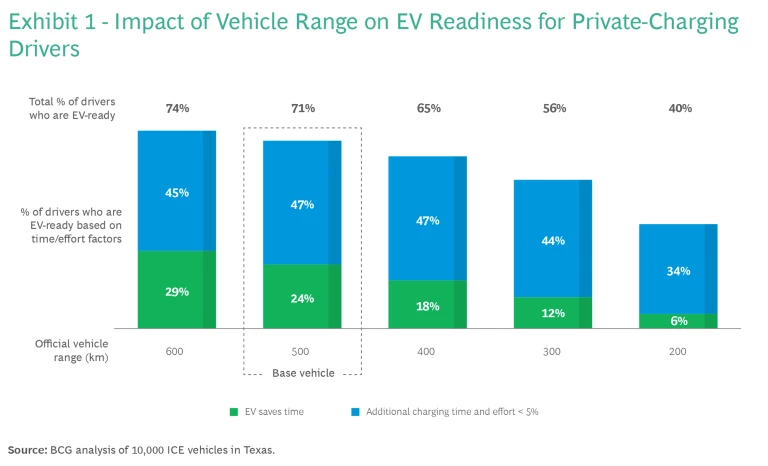
As the large majority of Texans live in single-family houses in areas of mid-low population density where it is easy to install home charging systems, we found that most drivers in our sample can install private charging. Thus, we estimate that 50% of Texans are EV-ready.
The potential prevalence of home charging in the state may explain why network density—the availability of public charging opportunities—does not seem to constrain EV penetration in Texas in the immediate future. Network density tends to be lower in areas where population density is low, and Texas fits that pattern: its charging network density is underdeveloped compared to other, more densely populated US states or European countries. In the Texas data sample, the median distance from end destination to charging station is 3 km and the average distance is 7 km. Comparing densely populated areas, charging networks in New York and California have 3 to 4 times higher density, and Florida’s network density is 1.6 times higher. The gap is often higher between Texas and other states in areas where population density is low. These states might have a higher EV-readiness level than Texas under the public charging scenario.
Leveraging this analysis and additional perspective from our research in the auto industry, we identified six archetypes of ICE vehicle drivers and EV readiness: three with private charging access and three with only public charging access. Each demands a different approach to infrastructure investment, auto vehicle marketing, and customer engagement.
Archetypes of Drivers with Access to Private Charging
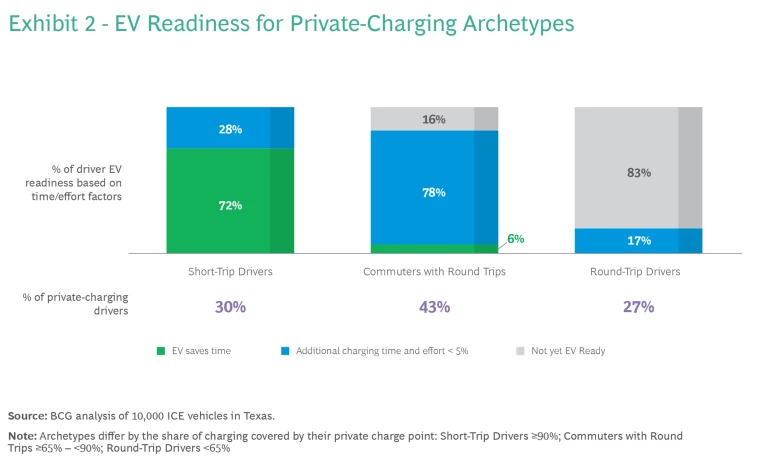
Access to private charging, largely taking place at home, is a key enabler for EV adoption. Among drivers who can access private charging, three archetypes emerged from our analysis. (See Exhibits 2 and 3.) For drivers like these, the benefits of EV adoption would extend beyond the time savings compared to ICE fueling. For example, over time the lower cost of electricity compared to gasoline would help EV owners save money.
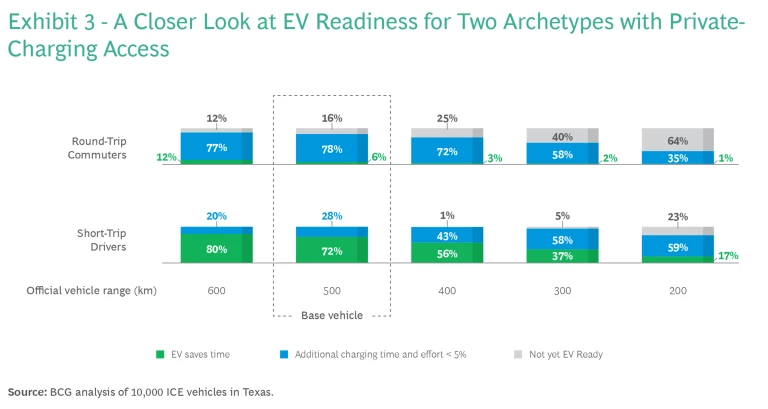
- Short-Trip Drivers (30% of the private-charging group) largely stay close to home, using their car for shopping, local errands, and to visit friends and family. A typical example is “Retiree Rita,” a former teacher living on a pension. Even lower-cost, limited-range EVs with only 200 km range are suitable for these drivers. If they drive EVs with ranges of 400–500 km, they consistently save time compared to ICE fueling.
- Commuters with Round Trips (43% of this group) may range further from home at times, but they are still able to charge at home for most of their driving needs. “Accountant Ahmad” uses his car to commute to work in Houston and sometimes visit clients in Dallas. A mid-range 300–400 km EV can suit most people in this archetype. If commuters can also charge their EVs at work, this adds to their appeal.
- Round-Trip Drivers (27% of this group) cannot fully gain time-saving benefits from at-home charging because they often travel long distances. Most of them are like “Salesman Sanjit”—they are ready to switch to an EV with 500 km range if some improvements are made in their local charging networks.
Archetypes of Drivers Who Can Only Access Public Charging
Those who cannot install a charger at home or charge their cars at work must rely on public charging points. The additional time and effort for these drivers depends on the local charging network. Unlike with the private charging group, the “EV saves time” factor affecting drivers’ readiness to switch from an ICE is generally not applicable to the public charging group. (See Exhibit 4.) There are three public-charging-access archetypes.
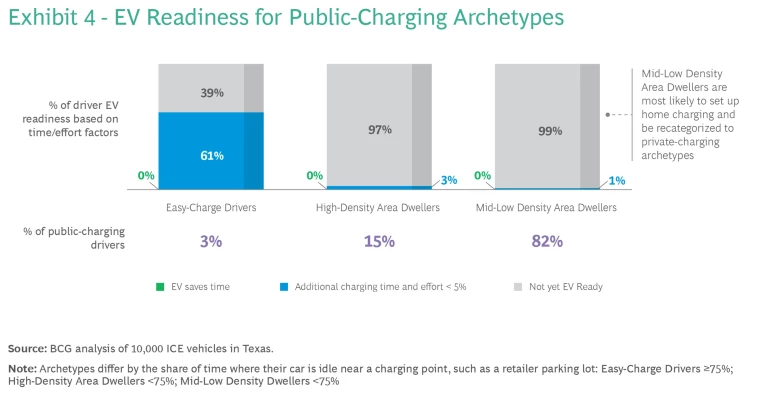
- Easy-Charge Drivers (3% of the public-charging group) live or work in areas with dense charging networks. They rarely have to travel more than a few hundred meters to charge. “Lawyer Lucia” is typical of this group; she has a recharging station near her office. Many of these drivers would switch to an EV if they can buy one with a 500 km range. They also might worry that as EVs become popular, other drivers will occupy their preferred charging points.
- High-Density Area Dwellers (15% of this group) like “Architect Arthur” must often plan ahead to find charging points as they might need to walk several blocks or more from the charging point to their destination. Most of them will be ready to switch to a 500 km range EV only with increases in the density and speed of the charging network.
- Mid-Low Density Area Dwellers (82% of this group) are like “Veterinarian Vaneta,” who works with farm livestock. She lives in a small apartment in a rural town where network improvements would be necessary to increase her EV readiness. We expect this archetype to be a relatively small group, because most residents of these areas live in single-family houses and would set up home charging stations, becoming a private-charging archetype.
Capturing Opportunities to Expand EV Adoption
So what does this all mean for automakers, dealers, and policy makers who are trying to move the needle on EV adoption? Armed with similar data and analysis from a particular market or region, automakers and retailers can target receptive customer segments, while government planners should focus on charge technology and density that spurs EV readiness.
Automakers: Segment Your Customer Base
Based on our simulation, OEMs selling electric vehicles with a 300–400 km range can already satisfy the needs of many drivers—particularly Short-Trip Drivers and Commuters with Round Trips. Analytics can reveal the subtle differences among drivers that can convert this finding into EV sales.
By looking at data from connected vehicles, automakers can segment their customer base and customize their marketing efforts to target high EV-readiness drivers with effective campaigns that demonstrate cost savings and lifestyle advantages. To actually recommend EVs to drivers, this analysis must be integrated with additional information—such as purchasers’ spending capacity and needs for seating, body type, and accessories—to optimize customer satisfaction with their new electric vehicle.
Infrastructure Planners: Accelerate the Transition
With private charging as the key motivating factor for EV readiness, the priority for infrastructure planners is to support the creation of home and work charging points. Policy makers should couple incentives with the removal of regulatory restrictions, making it easier for people and organizations to set up the necessary technology. For example, gated communities should be encouraged to permit EV chargers.
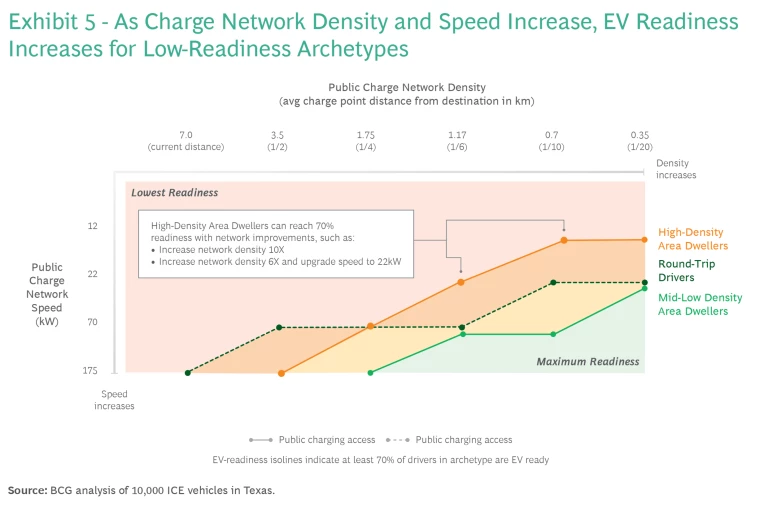
Public charging networks can improve EV readiness along three key dimensions: density (reducing the distance required to reach charging points), speed (reducing the time needed to charge a vehicle), and number of charging points (reducing the wait time for an available charger). As EV penetration grows, the expansion of charging points should ensure that a charger is always available, and therefore this factor will not impact EV readiness.
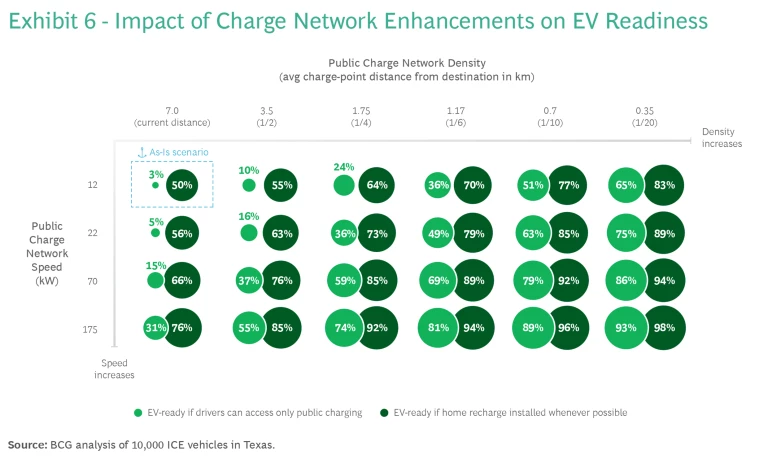
Exhibit 5 shows how improvements in network density and charger speed affect the three archetypes with the lowest EV readiness. For example, improving charge speed has particular value in promoting readiness for Round-Trip Drivers because they must charge their cars more frequently enroute (often on highways) than the other archetypes. Exhibit 6 shows how overall EV readiness evolves with improvements in the charging network. In every case, EV readiness improves dramatically when home recharging is installed and available wherever possible.
Electric vehicles are key to accelerating the energy transition and achieving urgent climate change goals. EVs are the future of transportation. Many groups have important roles to play in making all drivers EV-ready. Analyzing data from connected cars, demographic surveys, and other sources can help identify the “next waves” of EV adopters who will make the switch in response to improvements in vehicle range, charging speed, and network density.
The authors wish to thank Saba Dowlatshahi, Daniel Madden, Kamal Darchini, Hart Wilmarth, and Markus Hagenmaier for their input and Dhanya Nair and Adhikansh Sharma from the BCG X Geoanalytics team for their support.


