
Buoyed by strong capital markets in 2023, the average annual total shareholder return surged across the companies in BCG’s Value Creators database. The median rose to 12% per year from 2019 through 2023—up from 7% per year from 2018 through 2022.
Technology and tech-related companies led the charge, as excitement over generative AI helped to fuel a rebound from 2022’s losses. The landscape is not solely tech dominated, however. Several asset-heavy industrial sectors or recently lagging industries also accelerated their TSR performance compared with last year’s study and now rank near the top of our industry ranking. With global market indices perched at all-time highs, companies across sectors now face the challenge of maintaining or regaining TSR momentum.
For the past 26 years, BCG has been ranking companies on the basis of TSR, a metric that reflects the true bottom line for a company’s shareholders. Over the years, these rankings have yielded tangible insights that help companies create strong and sustainable value over the long term. The 2024 Value Creators rankings detailed in the linked interactive are based on data as of December 31, 2023, and reflect average annual TSR over the five years from 2019 through 2023. The sample includes 2,355 companies across 35 industries.
TSR Accelerated for Many Industries
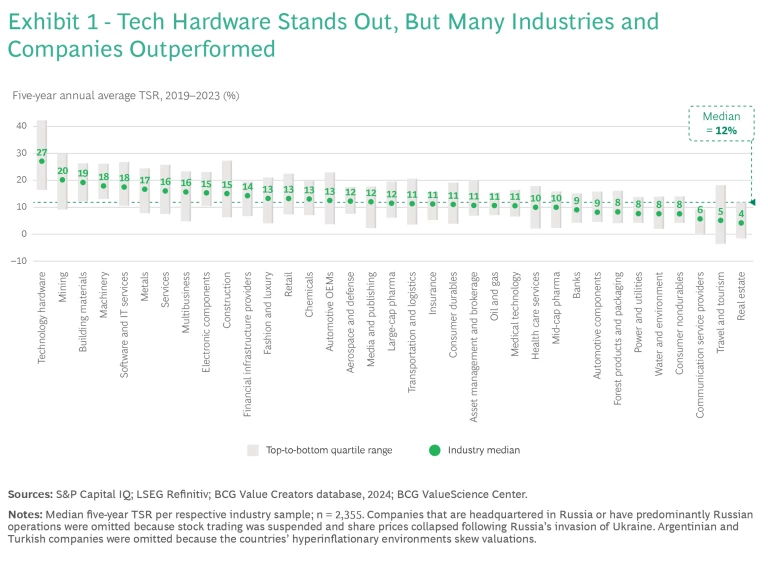
The 2024 rankings revealed a broad range of TSR performance within each of the industries we studied, showing that all companies have the opportunity to outperform the broader market, regardless of their industry dynamics.
Technology hardware emerged as the standout industry for value creation, boasting a median TSR of 27% per year from 2019 through 2023. (See Exhibit 1.) Value creation was especially impressive among mega-cap companies and semiconductor manufacturers. The software and electrical components industries also maintained their strong TSR trajectory, ranking 5th and 9th, respectively, among the 35 industries.

Not surprisingly, technology and tech-related companies also continue to dominate our large-cap value creators ranking, covering the 200 most valuable companies worldwide. Within this elite group, tech hardware companies secure five of the top ten spots and nine of the top 20. The prominent names include NVIDIA, the top performer, and Apple, boasting a $3 trillion market cap at the end of 2023. Software players, such as ServiceNow and Shopify, also make the list, alongside electric-vehicle giants Tesla and BYD and retail powerhouses PDD and Mercado Libre.
Although high-flying technology companies grab the headlines, our 2024 rankings highlight two other sets of industries that also achieved TSR gains substantially above the market average of 5% compared with last year’s rankings. (See Exhibit 2.)
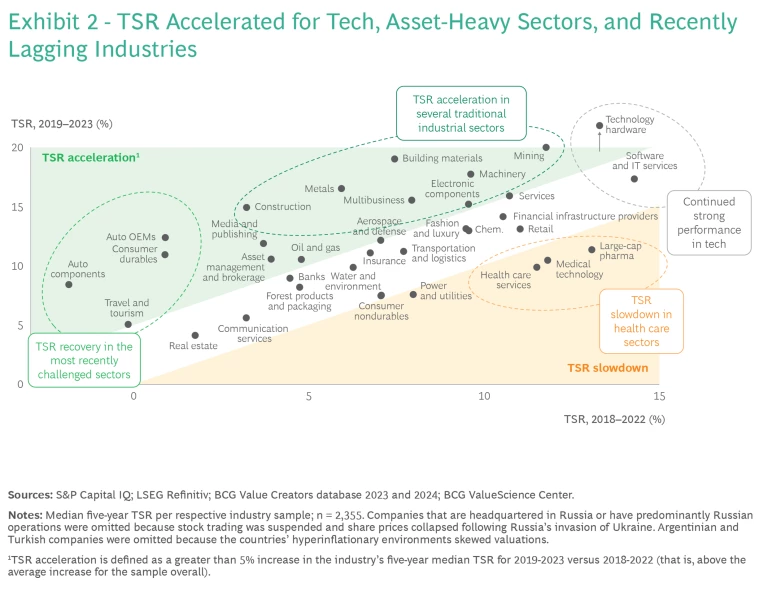
The first group consists of traditional, asset-heavy industrial sectors. These include mining (ranking 2nd), building materials (3rd), machinery (4th), metals (6th), multibusiness conglomerates (8th), and construction (10th). The strong performance of building materials and construction was driven by the US market which, unlike Europe, sidestepped a recession despite high interest rates. Leading metals and mining companies —TSR laggards through 2018—benefited from a resurgence in investor support during the five years covered by the rankings.
The second group comprises industries that had faced TSR headwinds from 2018 through 2022 but enjoyed strong recoveries in 2023. These include industries that rely on significant consumer spending: automotives (OEMs and component suppliers), consumer durables, and travel and tourism. Investors were apprehensive about such companies during the pandemic years but appear to have regained a degree of confidence based on stronger than expected consumer spending in 2023.
In contrast, several health care sectors—large-cap pharma, medical technology, and health care services—experienced a TSR slowdown, even though their median returns continued to surpass 10% annually. During the pandemic, some companies in these sectors saw profits surge, demonstrating their ability to deliver extraordinary returns thanks to innovative treatments. Now, with a more stable health care landscape, investors appear to be recalibrating their expectations for the long-term prospects of these competitive sectors.
The large number of leading firms in technology and other highly ranked industries, as well as more favorable macroeconomic conditions, has allowed North American companies to expand their representation in the global value creators rankings. These firms occupy 38 spots among the top 100 value creators, up from 27 in the 2023 rankings. They also now hold 41% of the top ten positions in their respective industries, rising from 38% in 2023. Asia-Pacific companies continue to claim an outsized share, with 51 spots among the top 100 and 39% of the top ten by industry. Conversely, European companies remain underrepresented among the top performers. Despite making up 20% of the overall sample, they secured only 9 of the 100 leading spots and 13% of the top ten positions across industries.
The Playbook Going Forward
Looking ahead, many companies will find it difficult to exceed the bullish expectations reflected in today’s buoyant market. To maintain investor confidence and TSR momentum, each company must establish a clear path to growing its business profitably. This will often require investing in innovation, such as artificial intelligence and sustainability, to open disruptive new avenues for value creation.
Faced with high expectations and the ever-present risk of a market correction, companies in high-flying sectors need to focus on the factors within their control, such as ensuring cost efficiency and investing to foster long-term growth and support their current valuation. In many cases, real innovations will be essential to allow these companies to navigate market fluctuations and maintain investors’ enthusiasm over the long haul.
Companies that have not been riding the recent market tailwinds have greater upside opportunities. They need to gain investor confidence by devising compelling value creation plans and clearly communicating their strategies.
To explore the Value Creators reports through the years, visit our Collection page.
Methodology
We eliminated companies that either were not listed on a world stock exchange for the full five years of our study or did not currently trade at least 20% of their shares in public capital markets. We allow exceptions to this rule for companies that are regarded as key industry players. In addition, we eliminated companies for which five-year TSR was distorted by exogenous factors, such as speculative trading not based on fundamentals. We also eliminated companies that are headquartered in Russia or have predominantly Russian operations. Finally, we eliminated Argentinian and Turkish companies because these countries’ hyperinflationary environment skews valuations.
We further refined the sample by organizing the remaining companies into 35 industry groups and establishing an appropriate market capitalization hurdle to eliminate the smallest companies in each group. (We identify the size of the hurdle for each industry in the interactive.)
Our global large-cap ranking focuses on the top 50 companies among the 200 largest companies by market capitalization. We based the global and industry rankings on five-year average TSR performance for the individual companies from 2019 through 2023. TSRs and the contributing financial metrics are based on a company’s reporting currency.
In addition, for all but four of the industry rankings, we divided TSR performance into the six investor-oriented financial metrics that BCG’s TSR disaggregation model uses: sales growth, margin change, multiple change (based on EBITDA), dividend yield, change in the number of shares outstanding, and change in net debt.
For four industries—asset management and brokerage, banking, insurance, and real estate—we used a slightly different approach to TSR disaggregation because of the special analytical problems involved in measuring value creation in those sectors. For asset management and brokerage and for real estate, equity growth replaces sales growth, return-on-equity change replaces margin change, and the price-to-earnings multiple replaces the EBITDA multiple. Change in net debt is not shown. For banking and for insurance, equity growth replaces sales growth, and the price-to-book multiple replaces the EBITDA multiple. Margin change and change in net debt are not shown.
The interactive and this article reflect the rankings of companies in our 2024 database and do not include companies that dropped off the list prior to 2024 as a result of mergers, bankruptcies, or other events. For that reason, the rankings from previous Value Creators reports may be slightly different.
Sources: S&P Capital IQ; LSEG Refinitiv; BCG ValueScience Center.
Note: Market capitalization of equity is shown as of December 31, 2023. The location shown is of the corporate headquarters. The contribution of each factor in the TSR disaggregation to the five-year average TSR is shown in percentage points. Dividend yield may include cash dividends, special dividends, proceeds from spinoffs, other extraordinary payouts and adjustments for share splits, issuance of bonus shares, or other one-off events. Although disaggregation is multiplicative, it is converted and shown here as additive, with remainders assigned to the margin and multiple change fields. Because of rounding, the numbers may not add up to the TSR figure shown. Share change refers to the change in the number of shares outstanding, not to the change in share price. Net debt change refers to the change in market capitalization relative to the change in enterprise value, and it includes the change in debt and cash.
Disclaimer: The materials contained in the interactive and article are designed for information purposes only. BCG does not provide fairness opinions or valuations of market transactions, and these materials should not be relied on or construed as such. A company’s inclusion in the ranking does not represent an endorsement by BCG. The interactive and article does not provide investment or financial advice. Users should contact their advisor to receive such advice.
BCG has used publicly available data. BCG has not independently verified the data and assumptions used in these analyses. BCG has made no undertaking to update these materials after the date they were gathered for publication, after which such information may become outdated or inaccurate. Changes in the underlying data or operating assumptions will have an impact on the analyses and conclusions. The underlying model used for the interactive and article is designed to work across industries and is no replacement for a detailed calculation that accommodates company- or industry-specific adjustments, which may have an impact on the accuracy of the results.


