At the end of each calendar year since 1998, BCG has published a review of value creation patterns and a ranking of the top value creators for the previous five years. We use a five-year span because long-term value creation matters, and we use end-of-year for comparability over time. In some years, market shifts after December 31 can be dramatic, as we saw with the March 2020 onset of the COVID-19 pandemic and as we are seeing now with the ongoing shifts in US trade policy. So this year, while we will still analyze past trends and celebrate winners, we will also look ahead.
Over the last five years, the market’s TSR—despite the COVID dip and the 2022 correction—was largely in line with that of the previous five years. The median TSR across the 35 industries tracked in BCG’s Value Creators database was 9.8% from 2020 through 2024—slightly above the TSR of 9.6% for 2015 through 2019. And while technology stocks were a key TSR driver in the most recent five-year period, the strong stock market performance was much broader based: top-quartile players in nearly all of the 35 industries we track would have outperformed the overall market.
This year’s rankings of top value creators are based on average annual TSR over the five years from 2020 through 2024 (their performance can be explored via this interactive exhibit). The sample includes 2,345 companies across 35 industries. (For more on our methodology, refer to “About the Research.”)
About the Research
Since 1999, BCG has published annual rankings of top value creators based on total shareholder return over the previous five-year period. The 2025 rankings reflect our analysis of TSR at 2,345 companies worldwide from 2020 through 2024. To arrive at this sample, we began with TSR data provided by S&P Capital IQ—data that covers nearly 70,000 companies.
We eliminated companies that either were not listed on a world stock exchange for the full five years of our study or did not currently trade at least 20% of their shares in public capital markets. We allow exceptions to this rule for companies that are regarded as key industry players and whose stocks have sufficient liquidity. In addition, we eliminated companies for which five-year TSR was distorted by exogenous factors, such as speculative trading not based on fundamentals. We also eliminated companies that are headquartered in Russia or have predominantly Russian operations. Finally, we eliminated Argentinian, Turkish, and Venezuelan companies because these countries’ hyperinflationary environment skews valuations.
We further refined the sample by organizing the remaining companies into 35 industry groups and establishing an appropriate market capitalization hurdle to eliminate the smallest companies in each group. (We identify the size of the hurdle for each industry in the interactive exhibit.)
Our analysis of the TSR performance of 2019–2024’s top value creators for the 63 months ended March 31, 2025, relies on the same sources.
Our global large-cap ranking focuses on the top 50 of the 200 largest companies by market capitalization. We based the global and industry rankings on five-year average TSR performance for the individual companies from 2020 through 2024. TSRs and the contributing financial metrics are based on a company’s reporting currency.
In addition, for all but four of the industry rankings, we divided TSR performance into the six investor-oriented financial metrics that BCG’s TSR disaggregation model uses: sales growth, margin change, multiple change (based on EBITDA), dividend yield, change in the number of shares outstanding, and change in net debt plus leverage effect.
For four industries—asset management and brokerage, banking, insurance, and real estate—we used a slightly different approach to TSR disaggregation because of the special analytical problems involved in measuring value creation in those sectors. For asset management and brokerage and real estate, equity growth replaces sales growth, ROE change replaces margin change, and the price-to-earnings multiple replaces the EBITDA multiple. Change in net debt is not shown. For both banking and insurance, equity growth replaces sales growth and the price-to-book multiple replaces the EBITDA multiple. Margin change and change in net debt are not shown.
The interactive exhibit and this article reflect the rankings of companies in our 2025 database and do not include companies that dropped off the list before 2025 as a result of mergers, bankruptcies, or other events. For that reason, the rankings from previous Value Creators reports may be slightly different.
Sources: S&P Capital IQ; LSEG Workspace; BCG ValueScience Center.
Note: Market capitalization of equity is shown as of December 31, 2024. The location shown is of the corporate headquarters. The contribution of each factor in the TSR disaggregation to the five-year average TSR is shown in percentage points. Dividend yield may include cash dividends, special dividends, proceeds from spinoffs, other extraordinary payouts and adjustments for share splits, issuance of bonus shares, or other one-off events. Although disaggregation is multiplicative, it is converted and shown here as additive, with remainders assigned to the margin and multiple change fields. Because of rounding, the numbers may not add up to the TSR figure shown. Share change refers to the change in the number of shares outstanding, not to the change in share price. Net debt change refers to the change in market capitalization relative to the change in enterprise value, and it includes the change in debt and cash.
Disclaimer: The materials contained in the interactive and article are designed for information purposes only. BCG does not provide fairness opinions or valuations of market transactions, and these materials should not be relied on or construed as such. A company’s inclusion in the ranking does not represent an endorsement by BCG. The interactive and article do not provide investment or financial advice. Users should contact their advisors for such advice.
BCG has used publicly available data and has not independently verified the data and assumptions used in these analyses. BCG has made no undertaking to update these materials after the date they were gathered for publication, after which such information may become outdated or inaccurate. Changes in the underlying data or operating assumptions will have an impact on the analyses and conclusions. The underlying model used for the interactive and article is designed to work across industries and is no replacement for a detailed calculation that accommodates company- or industry-specific adjustments, which may have an impact on the accuracy of the results.
In the rest of this article, we will dive into industry and regional value creation trends through the end of 2024 and then offer some thoughts on future challenges and what will distinguish winners from losers going forward.
Tech Continued to Dominate, but Some More Traditional Industries Made a Comeback
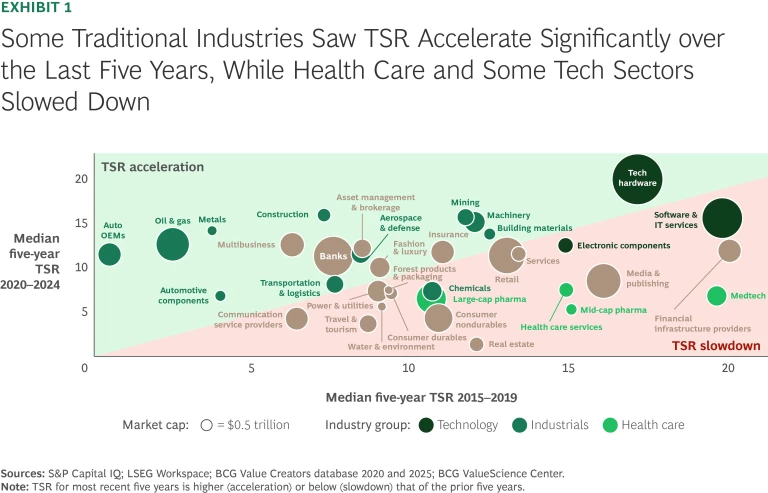
Of all the industries we track, only technology sectors—tech hardware, software and IT services, and electronic components—ranked in the top ten for TSR in each of our last five reports. That said, comparing TSR performance for the most recent five years with the five years before that, only tech hardware has seen its TSR continue to accelerate—likely driven by the rise of AI. The TSR for both software and electronic components, while still high, has slowed (see Exhibit 1).

At the same time, some more traditional industrial sectors—such as auto OEMs, oil and gas, metals, machinery, mining, construction, and aerospace and defense—have seen their TSR performance pick up. Given the high valuations in tech, investors may have been open to attractive equity stories in other areas, especially in previously underperforming sectors with attractive valuations. In contrast, we saw TSR decelerate across all health care sectors; for example, large-cap pharmaceuticals, after peaking at second place at the height of the pandemic, now ranks 29 of 35 industries on TSR in this year’s analysis.
Extending the analysis to include the first quarter of 2025, while nearly all industries suffered, the relative performance of industries did not change materially—and 38 of our top 50 large-cap value creators would have remained on the list.
Asia-Pacific Pulls Ahead of North America While Europe Struggles
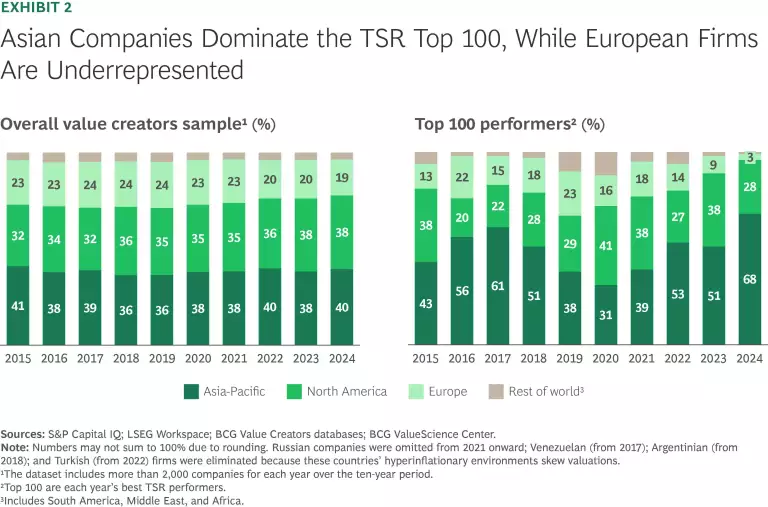
While companies based in the Asia-Pacific region constitute 40% of our full database, they captured 68 spots on this year’s list of the top 100 value creators, an impressive increase from last year’s already disproportionate showing (see Exhibit 2). Asia-Pacific’s rise has been largely driven by India, which now has 29 companies in the top 100 as well as 72 companies ranking in the top ten across our 35 industries. Companies from the Asia-Pacific region earned five or more top ten slots in 18 industries—and all ten in three: automotive components, consumer durables, and chemicals. Extending the analysis through Q1 2025 would not alter Asia-Pacific’s relative dominance.

By contrast, North American firms took 28 spots in the top 100, down from 38 last year, while representing 38% of the database. And companies in the region captured five or more top ten slots in 13 industries—and all ten in none.
European companies fared even worse, with just three companies among the top 100 value creators despite accounting for nearly one-fifth of the full database. Moreover, there are no European companies among the top ten value creators in 19 of the 35 industries we track—and eight industries have just a single European player in their top ten. Europe’s strongest industry positions are in large-cap pharmaceuticals, with four of the top ten, followed by banking, media and publishing, and fashion and luxury, each with three of the top ten.
Despite Stock Market Declines, Expectations Remain Near All-Time Highs
Most stock indices, after increasing early in Q1 2025, took a tumble in response to increased economic uncertainty driven by the shifting geopolitical and trade landscape. As of the end of the first quarter, 23 of the 35 industries in our database had delivered flat or negative median TSR.
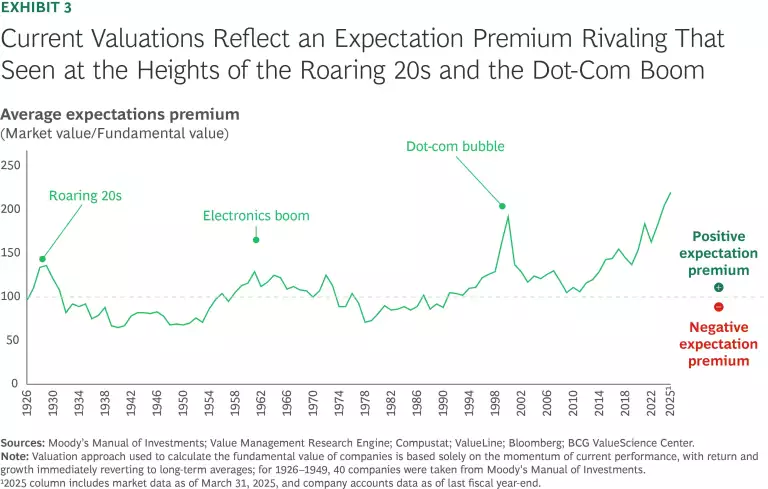
Despite that, our analysis suggests that a potential for further value creation headwinds remains. We looked at the “expectations premium” for US non-financial companies, the difference between their current market value and their underlying fundamental value. On average, the premium at the end of Q1 2025 was at the highest level since 1926—even exceeding the peak in 2000 at the height of the dot-com bubble (see Exhibit 3). And while the average expectations premium fell somewhat after the market’s significant drop in April 2025, it remains near a historic high. BCG’s latest investor survey, conducted in mid-April, supports this finding, with 62% of investors considering the market to be overvalued—essentially unchanged from their perceptions in our November 2024 survey.

What Will Determine Tomorrow’s Top Value Creators?
Particularly in uncertain times, the companies best able to see and seize shifting opportunities win. According to our latest investor survey, even in the current market environment, investors still want companies to invest for growth and long-term advantage. But as a practical matter, could there be a way to assess a company’s ability to deliver long-term growth and value in the face of uncertainty?
One promising metric, developed by BCG, is corporate vitality. It assesses a firm’s ability to turn positional strategic advantage into profitable growth. Firms with higher vitality tend to grow their revenues faster and generate higher TSR. The metric is based on more than 10 million datapoints from various financial and non-financial sources, is available for public and private companies, and covers more than 20 sub-metrics related to strategic outlook, technology, people, and culture that are proxies for a company’s vitality.
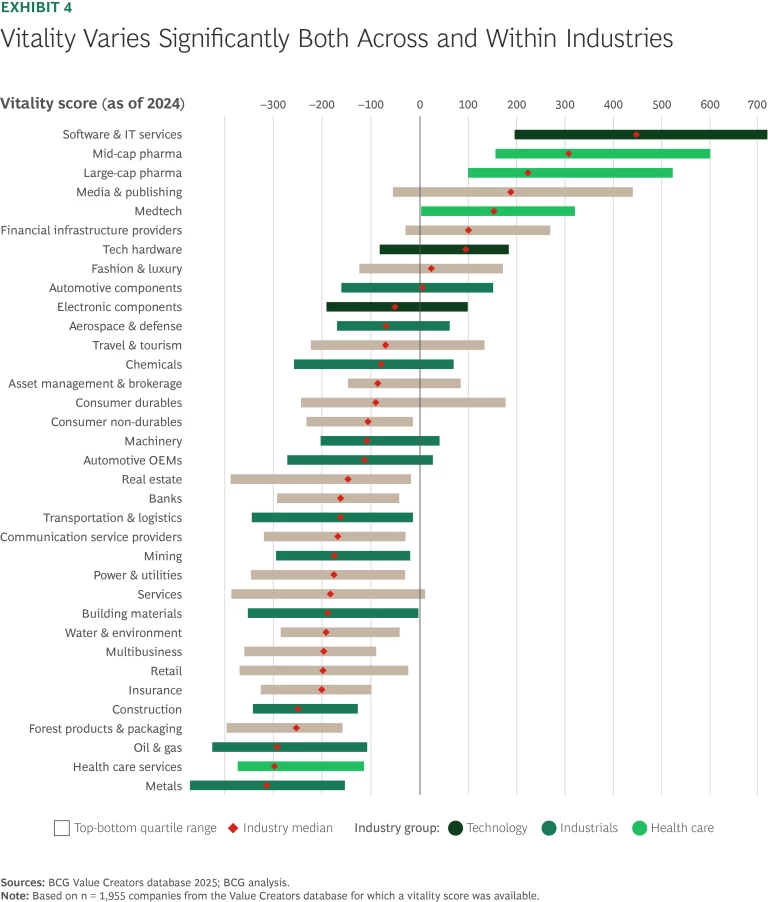
Vitality scores were available for nearly 2,000 of the 2,345 companies in our Value Creators database, which gave us an opportunity to explore the vitality landscape across the 35 industry sectors we track. We found significant variation in median vitality across industries (see Exhibit 4).

The top ten industries in terms of vitality skew heavily to tech and health care, with those two sectors capturing six spots. Media and publishing, financial infrastructure, fashion and luxury, and automotive components round out the list. Health care and media and publishing, both highly innovative sectors, performed relatively less strongly in TSR terms over the past five years, perhaps growing into high valuations that they had earned earlier. Industrials delivered strong TSR in our latest period despite being on the lower end of the vitality scale.
But vitality differences across industries often matter less than those within industries. Notably, there is significant variation in vitality within every industry. And that’s important, because when it comes to value creation in competitive settings, it is the vitality of the individual company relative to its rivals that determines long-term winners and losers. All it takes is one sharp insight and decisive action to change the game and give a company a meaningful competitive advantage.
Faced with ongoing uncertainty and shifts in global trade, how should companies be thinking about their value creation strategy? The best place to start is by going back to basics by doing two things:
- Winning the Fundamentals Game. At the end of the day, value creation is a function of four things: revenue growth, profit growth, valuation multiple, and cash payouts (i.e., dividends, buybacks, and debt reduction). So how might shifts in the strategic and operational environment affect those factors? For example, to what degree could tariffs or import barriers shrink your market access, your margins, or both, thus slowing your revenue and profit growth? Could price inflation slow top line growth or narrow margins? And most importantly, how should you respond to any of these developments?
- Boosting Resilience to a Shifting Global Macro Climate. To boost your resilience, a rigorous approach methodically identifying and pressure testing all your critical strategic assumptions is essential. Developing realistic but thought-provoking scenarios and carefully considering their impact on your value drivers and implications for action. There will be some no-regret moves—but many others that make sense only if the environment evolves in a certain way. Such an exercise will enable you to prioritize the right levers and prepare the organization to respond. Together with thoughtful investments into the right capabilities to foster innovation and differentiate the company from its peers, it positions companies to succeed even in the face of unexpected developments and can help shape a truly compelling long-term investment thesis.
Not every organization will take such a systematic strategic approach and shape a thoughtful response plan—but even in the toughest times, the most vital will find ways to be both great companies and great stocks.
The authors would like to thank the vitality team at the BCG Henderson Institute—and, in particular, Johann Harnoss—for their important contributions to this article.


