
Discover how RHI Magnesita, in collaboration with BCG, is revolutionizing its global production network, unlocking unparalleled efficiency, cost savings, and operational breakthroughs.
How BCG Works With Manufacturing Clients
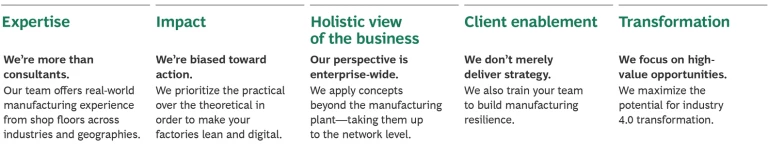
Our manufacturing consulting experts coach and enable our clients on strategic and operational initiatives, helping them innovate and digitize their shop floors—where value is created. Our experts, backed by advanced data and analytics and a dedicated engineering team, work with clients to cut through complexity and achieve successful manufacturing transformations.
Our manufacturing consulting focuses our clients on three essential guiding questions:
What Will You Manufacture?
Your product, product lines, and underlying components establish your manufacturing strategy. This includes what you make in-house versus buy through a supplier, as well as your supply chain and how you optimize it along with your manufacturing operations. BCG brings expertise in manufacturing strategy and organization, risk management, sustainable operations, and make-or-buy decisions.
Where Will You Manufacture?
You must decide not only in which locations your plants and distribution centers sit, but also how they’re optimized for such particulars as regulations, logistics, taxes, and duties. Our manufacturing consulting experts help clients make the best decisions using our advanced production network optimization tools like SNOW AI and the Global Manufacturing Cost-Competitiveness Index.
How Will You Manufacture?
BCG helps evaluate your supply chain by viewing your global manufacturing operations through an integrated lens—ensuring everything from your lean manufacturing practices to your use of advanced robotics performs at a world-class level. We help you envision and build factories of the future that incorporate
Industry 4.0 technologies, maintenance and production engineering strategies, logistics capabilities, lean production systems, and quality processes.
Our Approach to Manufacturing
BCG’s manufacturing consulting clients enjoy access to a broad range of resources, including our Innovation Center for Operations. The following are among the tools and offerings we deliver.
Rapid Plant Optimization
- BCG achieves results at your manufacturing sites by using methodologies and tools in lean, agile, and Industry 4.0. We identify improvement opportunities to optimize equipment assets, material use, labor, logistics, and overhead.
- We help implement integrated production systems, organizations, and cultures that are focused on continuous improvement so our clients can sustain change and focus on holistic impact on, and beyond, the shop floor.
Diagnostics
- Compass Performance Benchmarking by BCG. Our proprietary database solution enables companies to assess how their operations and manufacturing performance compares with that of their peers through performance benchmarks. The tool quickly reveals the gaps in and root causes of less than ideal performance, and shares the best opportunities for improvement to unlock competitive advantage.
- Pathfinder Performance Improvement by BCG. This comprehensive diagnostics and solution platform enables you to quickly assess the status of operations by comparing your maturity with best-in-class industry peers through topic-specific health checks. It then seamlessly defines improvement measures that can be prioritized, suggests technology vendors matched to your needs, and indicates specific savings potential.
- Global Manufacturing Cost-Competitiveness Index. This proprietary index tracks changes in direct manufacturing costs among the world’s top exporting economies. The index scores competitiveness on the basis of manufacturing wages, productivity, energy costs, and currency exchange rates. Using advanced network optimization in tandem with the index, BCG helps clients analyze future demand models, cost drivers in shipping and logistic costs, and manufacturing and supply requirements.
Design
- Model Factories. In Brazil, China, France, Germany, Ireland, Singapore, and the US, our experts conduct workshops, followed by assessments, that enable business leaders to learn and immerse themselves in every aspect of their global manufacturing operations.
- Technology Demonstrators. Have you heard about additive manufacturing for rapid prototyping? Are you intrigued by the idea of smart glasses for augmented reality? Are you curious to learn how the industrial metaverse can help you overcome quality problems? Test these technologies for yourself.
- A Partnership Ecosystem. We have forged longstanding partnerships with leading implementation experts. Our manufacturing consulting experts collaborate with and connect you to the leaders in IT architecture and digital solutions. We have also partnered with the World Economic Forum to examine the opportunities associated with data sharing in manufacturing and the enablers for building successful data-sharing ecosystems.
Implementation
- Manufacturing and Supply Chain Academy. Through training sessions, you can take part in 23 modules and experimental learning activities.
- Mobile Labs. We bring model factories to you, so you can learn about the latest in lean manufacturing and Industry 4.0 from our experts, and explore advanced robotics with the aid of a real-world practitioner.
Examples of Our Client Work in Manufacturing
55%
cost of goods sold recaptured
A pharmaceutical company asked BCG to optimize its production network. When we identified the best locations for offshore outsourcing, the company was able to recapture up to 55% of the cost of goods sold.
$30m
in savings
An industrial goods company was experiencing an unwanted byproduct of its success: an unwieldy production system and, by extension, unclear KPIs. BCG designed and then implemented a system to apply standardized metrics across plants, paving the way for $30 million in savings.
$120m
decrease in expense
For an automotive company, BCG focused on the question of whether the company should make or buy certain products. To arrive at a comprehensive answer, we evaluated relative costs and the strategic importance of parts and processes, modeled external prices, and then compared those projections with in-house prices. As a result, our client slashed expenses within its production network by $120 million per year.

Video
November 15, 2024

Client Success
To pioneer a digital transformation of its operations, global automotive supplier Forvia partnered with BCG to define its ambition and implement digital use cases. Here's how.
Press Release
December 15, 2023
BCG was named a leader in the IDC MarketScape: Worldwide Operations Improvement Consulting Services 2023–2024 Vendor Assessment due to our focus on fast, measurable impact through execution and more.
Our AI-Powered Manufacturing Solutions
Supply Chain AI
Supply Chain AI takes a holistic approach to transforming supply chains, from strategy and design through planning and optimized execution.
Supply Chain AI
Video
Video
Supply Network Optimization
Within Supply Chain AI, Supply Network Optimization helps build a resilient, sustainable, and cost-efficient product supply network.
Supply Network Optimization
Video

Video
Manufacturing AI
Built for manufacturing transformations, Manufacturing AI combines BCG's operations know-how with BCG X's advanced analytics capabilities.
Manufacturing AI
BCG-WEF Project: AI-Powered Industrial Operations
How can manufacturers harness the latest technologies to optimize for increased productivity, improved sustainability, greater resilience, and a stronger workforce?
Navigating Tariffs
Explore facts about tariffs, debunk common myths, and understand their real impact on your business.
Our Latest Insights in Manufacturing

Article
April 3, 2025
Every company, regardless of sector or location, needs to build tariffs and the related uncertainty into its planning and operating model.

Article
December 13, 2024
To design a COGS program that delivers sustainable savings, manufacturers should address five critical areas.