


Managing Director & Senior Partner
Chicago

Related Expertise: Corporate Finance and Strategy, Value Creation Strategy
BCG’s 2021 Value Creators rankings indicate that the upheavals induced by COVID-19 did not fundamentally alter the value creation trajectory of companies across the globe. Indeed, it appears that the pandemic generally widened preexisting gaps between leaders and laggards across regions and industries. This trend raises the stakes for all companies: top performers face record-high expectations and valuation levels, while underperformers must deal with mounting pressure, including from activists ready to engage after waiting out the market turbulence.
To create value coming out of the global pandemic, investors want companies to focus heavily on middle- to long-term performance. Doing so entails prioritizing the right investments—developing key technologies and talent, making the right portfolio choices, and having a well-aligned sustainability strategy.
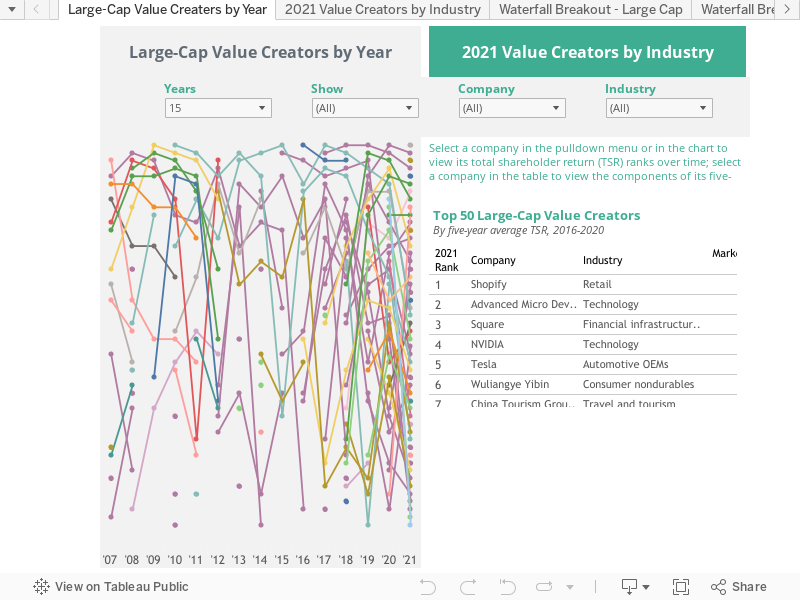
For the past 23 years, BCG has been ranking companies on the basis of total shareholder return (TSR), a metric that reflects the true bottom line for a company’s shareholders. Over the years, these rankings have yielded tangible insights that help companies create value over the long term. The 2021 Value Creators rankings detailed in the interactive above are based on data as of December 31, 2020, and reflect average annual TSR over the five years from 2016 through 2020.
Even as the world suffered from the impact of COVID-19, the strong capital market performance that characterized most of the preceding decade continued in 2020. Indeed, in our sample of approximately 2,400 companies, the average annual TSR for the preceding five years was 10.3%, up from 9.6% a year earlier.
Over the course of 2020, including the pandemic-induced dip and the sharp recovery, the S&P Global 1200 delivered TSR of 29%—an exceptional figure compared with the recent bull market and with rebounds from other market declines such as the 2000–2001 dot-com bubble and the 2008–2009 financial crisis. In both of those rebounds, global capital markets took more than five years to return to and then exceed precrisis levels.
The pandemic’s effects on this year’s rankings are evident in the greater-than-usual dispersion of TSR among companies and industries. However, although the spread between the leaders and the laggards is more pronounced this year, the patterns we observe across regions and industries are largely consistent with familiar themes.
From a regional perspective, the US outperformed the high TSR standard set by the global markets in 2020, as the S&P 500 gained 31%. Only Asian markets that overcome pandemic-related macroeconomic headwinds relatively quickly—such as South Korea, Japan, and China—saw stronger performance.
Viewed over the full five-year period, North American companies are reasserting their dominance as value creators. In last year’s rankings, Asian and European companies were overrepresented among the top performers across industries, signaling a modest shift away from North American companies. In this year’s rankings, North American companies reclaimed the leading position and are overrepresented among both global top performers and industry TSR leaders. (See Exhibit 1.)
A handful of industries largely drove the strong global TSR. As the interactive shows, the industries at the top of our rankings include technology companies, medtech companies, financial infrastructure providers, and green energy players. (An exception to the heavy tilt at the top toward technology-focused industries is the mining industry, which benefited significantly from a cyclical rebound.) Technology, which accounts for more than 20% of total worldwide market capitalization, delivered TSR of more than 50%, on average, in part because investors regarded technology stocks as a safe haven during the crisis. Also in the top echelon were traditional brick-and-mortar industries that have become more technology enabled or digitized in recent years, such as machinery, media and publishing, and health care services.
The trajectories of industries that had the strongest TSR momentum in 2020 remained intact for the most part, with some notable exceptions. (See Exhibit 2.) Technology, green energy and environment, and midsize pharmaceuticals accelerated their TSR as they benefited from investors’ longer-term focus. At the other end of the spectrum, both travel and tourism and oil and gas suffered significant harm from pandemic-induced shutdowns. Oil and gas also felt the effects of the aftermath of the price war between Russia and Saudi Arabia.
Capital markets’ strong rebound during 2020 sets up a challenging environment for value creation going forward. For many industries, 2020 amplified a preexisting upward trend in valuation multiples. (See Exhibit 3.) Indeed, significantly higher valuation multiples have driven much of the robust performance by technology, medtech, financial infrastructure, and other top-performing industries. For example, technology companies, on average, saw their price-to-earnings multiples increase by 78% from December 2015 through December 2020.
For technology companies and many others, the high expectations reflected in lofty valuations raise the bar for achieving strong and sustainable TSR going forward. If multiples contract in response to company-specific or broader market corrections, it can create significant TSR headwinds that companies must offset with other levers: growth, margin improvement, or cash payouts.
To realize the potential reflected in current valuations, companies need to build organizational capabilities that will enable them to meet middle- to long-term performance expectations. Since the onset of COVID-19, BCG’s Investor Pulse Check series has consistently found that investors want companies to prioritize investments in the key capabilities required to win going forward, even at the expense of short-term performance (such as meeting guidance and consensus expectations for earnings per share or protecting margins). Although this mindset often differs sharply from the one that historically made large corporations successful, investors are now giving companies the required leeway.
Setting up companies for long-term success has two other important aspects. First, management must make the right portfolio choices. This means acquiring businesses that will strengthen the company and divesting those that could be TSR laggards or might fetch a premium in today’s market. Second, companies need a sound sustainability strategy. This entails defining and executing a clear and compelling environmental, social, and governance (ESG) agenda. Not surprisingly, in BCG’s Investor Pulse Check surveys—and in the 2021 investor survey—investors have emphasized the importance of portfolio reshaping and delivering on ESG.
The interactive format allows you to delve deeper into the TSR performance of the top 50 large-cap companies in our 2021 rankings—including examining how their performance has evolved since we initiated our Value Creators series in 1999—and into the TSR performance of companies across 33 industries. The interactive presentation also disaggregates the TSR performance of individual companies into its key components.


Senior Advisor
Chicago


Knowledge Expert, Team Manager
Munich
ABOUT BOSTON CONSULTING GROUP
Boston Consulting Group partners with leaders in business and society to tackle their most important challenges and capture their greatest opportunities. BCG was the pioneer in business strategy when it was founded in 1963. Today, we work closely with clients to embrace a transformational approach aimed at benefiting all stakeholders—empowering organizations to grow, build sustainable competitive advantage, and drive positive societal impact.
Our diverse, global teams bring deep industry and functional expertise and a range of perspectives that question the status quo and spark change. BCG delivers solutions through leading-edge management consulting, technology and design, and corporate and digital ventures. We work in a uniquely collaborative model across the firm and throughout all levels of the client organization, fueled by the goal of helping our clients thrive and enabling them to make the world a better place.
© Boston Consulting Group 2024. All rights reserved.
For information or permission to reprint, please contact BCG at permissions@bcg.com. To find the latest BCG content and register to receive e-alerts on this topic or others, please visit bcg.com. Follow Boston Consulting Group on Facebook and X (formerly Twitter).