The global health care industry is at an inflection point. Populations are aging in the U.S., Europe, and other mature markets and thus require more care. Reforms in the U.S. are providing insurance for many who previously lacked coverage and bringing more people into the health care system. The middle class is growing in emerging markets, and those consumers are demanding greater access to care and are also experiencing increased rates of lifestyle diseases. At the same time, changes are afoot in the way that care gets delivered, evaluated, and paid for, with the goal of creating better outcomes for more people at lower costs. These dual trends—growth and reforms—will have a significant impact on the health-care-services industry, which we define as providers of care, payers, and secondary-services providers.
Overall, the health-care-services industry has shown remarkably strong performance in terms of value creation in the past decade, as measured by total shareholder return (TSR).

Moreover, the TSR performance of health-care-services companies has been less variable than that of other segments of the health care industry—such as biopharmaceutical companies—meaning that there is less disparity between the top and bottom performers. The combination of high returns and low variability offers an attractive risk-reward profile to investors. In part, that lack of variability stems from the relatively low competitive differentiation and moderate competitive pressure among health-care-services companies.
Clearly, many health-care-services companies are either nonprofit organizations or privately held, and they are not included in this analysis. Yet we believe that value creation patterns among the publicly held companies apply to nonprofit and privately held companies as well.
The Drivers of Value Creation
To better understand the key drivers of value creation, we looked at the performance of companies in the health-care-services sector over the past several years. (Similar studies analyze the value creation records of the biopharmaceutical and medical-technology sectors.)
Within the universe of 38 companies, we broke down the sector into three segments:
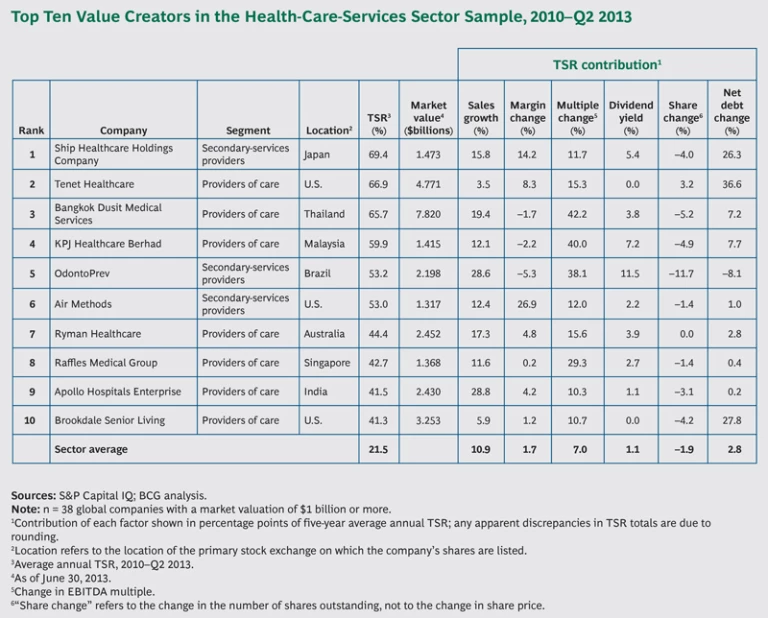
- Providers of care offer medical services directly to patients in dedicated facilities, across a diverse spectrum of specialties. Examples include Bangkok Dusit Medical Services (Thailand), Apollo Hospitals Enterprise (India), and Tenet Healthcare (U.S.).
- U.S. payers are a relatively homogeneous group of companies that offer health insurance plans in the U.S. in the commercial, Medicare, and Medicaid business areas. (Our sample includes only those health plans that are based in the U.S. given that those in other countries are typically not publicly traded.) Examples include Aetna, Cigna, and UnitedHealth Group.
- Secondary-services providers offer a diverse array of outsourced services such as diagnostics labs and pharmacy benefit management. Their customers are primarily payers or providers—not patients—in business-to-business models. Examples include Express Scripts (U.S.), Ship Healthcare (Japan), and Primary Health Care (Australia).
Within each of these three segments, we looked at the key drivers of value creation over the nearly four-year period from 2010 through the second quarter of 2013. This time period allowed us to set aside the disruptions of the financial crisis in 2008 and the recovery in 2009. These drivers include those related to operational measures (sales growth and changes to the EBITDA margin), those related to investor sentiment (change in valuation multiples), and those related to financial policy (dividend yield, changes in the number of shares outstanding, and changes in net debt).
In the aggregate, the 38 companies we analyzed generated 18 percent average annual TSR. Of that total, the biggest drivers for the overall sector are sales growth (12.3 percentage points), strong expectations among investors (as reflected in the expansion of valuation multiples, which contributed 8.8 percentage points), and—to a lesser extent—dividend policy. Those three elements combined for more than 18 percent average annual TSR, yet changes in the number of shares, net debt, and margins actually served as a slight drag on the overall value-creation performance over the period.
The strong contribution from sales growth shows that the sector has been generating shareholder value on the basis of its operational performance. Rising expectations from investors are also a factor, as manifested by the contribution from multiple changes. This is in direct contrast to the other health-care sectors we analyzed; for instance, in biopharmaceuticals, more of the value creation has come from investor optimism and less has come from enhanced operational performance.
While the performance of the overall health-care-services sector is impressive, value creation for the segments differs in key ways, and there is much to be learned by understanding the behavior within each segment. We discuss the results for each in more detail later in this report.
Three Distinct Periods of Performance
In addition to analyzing the sector over a nearly four-year window—2010 through the second quarter of 2013—we also looked at performance before and during the financial crisis. The relative performance of the three segments varies widely across these three periods.
The precrisis period from 2005 through 2007 was primarily a growth story. (See Exhibit 2.) Providers of care and U.S. payers saw substantial and accelerating sales growth. Yet the contribution to TSR from changes in net debt was negative across all three segments. Secondary-services providers had the strongest TSR performance during this period (24.5 percent), followed by U.S. payers and providers of care—15.6 percent and 9.1 percent, respectively.

When the crisis hit, U.S. payers felt the pain most acutely. (See Exhibit 3.) Annual TSR plummeted to an average of –23.5 percent in 2008 and 2009. The annual TSR of providers of care was relatively flat (–0.6 percent), yet for both segments, the declines compared with precrisis performance were due primarily to sharp contractions in valuation multiples—that is, declining confidence among investors. By comparison, performance among secondary-services providers remained positive, at 4.6 percent average annual TSR.

And in the strong sector recovery that followed the crisis—during the period from 2010 through the second quarter of 2013—value creation has been driven by sales growth and multiple expansion. (See Exhibit 4.) Providers of care rebounded most strongly (24.1 percent average annual TSR), followed by U.S. payers (20.7 percent). Although secondary-services providers showed the strongest TSR performance before and during the crisis, they have not performed as well since then, with the lowest TSR of the three groups, at 9.0 percent.

Evolving Trends That Will Shape the Sector
We see several major trends driving continued value creation for health-care-services companies.
The first trend is growth. Demographic trends such as aging populations are causing patient volumes to grow, and reforms in the U.S. mean that more people are entering the system, some for the first time. Because of these factors, investors have high expectations for growth among health-care-services companies, potentially even greater than for biopharmaceutical players.
Another major trend is an increasing focus on health care value: The delivery of care and the way that costs are covered are shifting from a volume-based, fee-for-service approach to a more sophisticated approach that focuses on outcomes and costs per patient. Health care systems in markets throughout the world are increasingly using big data and informatics to document and track different clinical approaches and outcomes, with the goal of improving health outcomes while maintaining or lowering costs—what is called value-based health care (VBHC). (See Competing on Outcomes: Winning Strategies for Value-Based Health Care, BCG Focus, January 2014.)
In addition, margin compression is a growing factor, as costs continue to rise faster than GDP, increasing the relative burden on public and private payers. As a result, reforms and new policies are in place to address this, creating external pressure for both providers of care and payers to meet the needs of larger populations at lower costs. (Even as volumes increase, the growth rate of health care spending in the U.S. is now slowing for the first time.)
In fact, the balance between growth and margins is the central story for the sector moving forward. To date, some companies have been willing to sacrifice margins in order to focus on growth. However, to truly deliver better shareholder value, higher volumes need to translate into better outcomes with a price premium, greater efficiency, or both. How to deliver better outcomes and improve margins? In some cases, success will require new models of collaboration across the care chain—a significant departure for many players, which are accustomed to operating at arm’s length, if not antagonistically. The answer may also lie in scale. With the right low-cost operating models, they can achieve gains by applying that model to a larger customer base.
Finally, the use of cash will be critical. Generating cash on a sustainable basis opens up financial-management strategies, such as buying back shares, adjusting dividends, and reducing debt.
While these trends will impact all health-care-services companies, each of the segments faces a unique set of operational and financial challenges. In the remainder of this report, we discuss the results and imperatives for each segment.
Results and Imperatives for Providers of Care
Of the three segments we analyzed, providers of care showed the strongest average annual TSR (24 percent), with the biggest drivers coming from valuation multiples, sales growth, and changes to net debt. In part, the strong value-creation performance stems from an expected increase in patient volumes, owing to the growth factors mentioned previously (more U.S. patients in the system, aging populations in many mature markets, and growing rates of lifestyle diseases among the expanding middle classes in emerging markets).
We also applied a location-based lens to the results and looked at TSR performance for three regions in which the 19 companies in our sample of providers are based: the U.S., non-U.S. established markets (defined here as Australia, France, Germany, Japan, New Zealand, and the UK), and emerging markets (Brazil, Chile, India, Malaysia, Singapore, South Africa, and Thailand). This analysis applies to providers of care and secondary-services providers.
This analysis shows that value creation differs significantly across locations. Providers of care in emerging markets posted a higher annual TSR (39 percent) than those in established markets (22 percent) or those in the U.S. specifically (18 percent). (See Exhibit 5.) In emerging markets, volume growth is even more pronounced, as a result of the growing middle classes; 7 of the top 10 providers of care in our analysis—and 5 of the top 10 companies in the entire universe of 38 companies—are based in emerging markets.

Given that providers of care constitute the largest share of overall health-care spending—as much as 70 percent, according to some estimates—they will likely face strong margin pressure as health care spending continues to grow and faces increasing scrutiny. There is notable uncertainty over cost-containment measures and other reforms that would potentially reduce their margins, unless providers can establish and prove the quality of service they offer.
In the U.S., the provider market is projected to grow at a strong rate through 2017, in part because of Affordable Care Act (ACA) reforms, which will bring new patients into the system. That translates to anticipated revenue growth at a compound annual rate of 6.5 percent.
Given these challenges, direct providers of care should heed several key imperatives:
Focus on Areas Where They Can Deliver Superior Value
Players need to identify specific markets—attractive outpatient services, high-volume surgical procedures, highly specialized procedures with differentiated outcomes, and so on—where they have a clear competitive advantage in terms of patient outcomes and efficiency.
Improve Clinical Performance
Fundamentally, providers need to improve the way that they deliver care to patients. In the VBHC environment, performance becomes far more transparent, making clinical performance a huge lever of differentiation for hospitals. Big data makes it easier to determine which providers (and which payers) are truly improving health outcomes and delivering value. In addition to traditional health indicators, this increasingly requires looking at how patients view their care experience. Such an analysis raises the bar for providers, but it also creates opportunities for those that can truly excel in clinical performance. Outcome improvements can reduce the average length of stay for specific procedures and readmission rates, thus improving profitability at the same time.
Equally important, better outcomes will warrant higher reimbursement rates and win favor among payers, giving top-performing providers of care an edge over peers that have weaker outcomes. Superior outcomes will also generate greater interest from investors.
Collaborate Across the Care Chain
Advantages will also accrue to those companies that can better manage the health care value chain and help deliver the improved outcomes and cost savings mentioned previously. That creates opportunities for providers that can expand upstream or downstream into promising areas (such as ambulatory or home care) or develop partnerships with players that are already there.
Collaboration across the chain helps reduce friction and interface costs at the boundaries of different elements in the chain. In addition, institutions gain from being large enough to place patients at the right point in the care chain. For example, a health system benefits from having the capacity to put a patient who needs basic care into a standard hospital, while saving slots at other institutions for critical-care patients who need more-specialized treatment. Similarly, health systems that can get the right care to patients as early as possible can often stop conditions from escalating to the point that patients require more complex and expensive care later on.
In addition, integration can help providers strengthen their collaboration with payers, which will become increasingly sophisticated in how they analyze care outcomes and reimburse patients and providers. In this effort, information sharing between both organizations is critical to improve outcomes and reduce costs.
Grow to “Smart Scale” Through Selective M&A Activities
The current provider landscape is still fragmented. Given cost pressures, consolidation is increasing, resulting in larger networks of providers. Moreover, in a VBHC world, the experience curve is very important for improving outcomes among specific patient groups. Facilities that have insufficient volumes of certain treatments and procedures will be challenged to improve their outcomes in meaningful ways and remain competitive.
However, scale will help only those organizations that can execute the subsequent integration and reorganization initiatives in a smart way. Unlike pure scale, “smart scale” entails increasing a company’s footprint in a very targeted fashion, to grow to the next level on a regional or patient-population basis. This concept is more applicable for health care providers than for other industries because of the hands-on, infrastructure-dependent nature of the service they provide.
For Emerging-Market Providers, Ensure That Growth Is Profitable
In an environment characterized by rapid growth, it is easy to focus on sheer volume instead of margins. Yet management teams in emerging markets should resist this tendency and avoid chasing growth for its own sake. Rather, they should ensure that they are building a sustainable foundation for their business, by focusing on margins and profitability as well as top-line expansion.
Results and Imperatives for U.S. Payers
For several years during the design phase of the Affordable Care Act, market perceptions of U.S. payers were highly unsettled, owing to questions about how reforms would impact payers. Now that the key elements of ACA reforms are being implemented, there is much more clarity. Currently, the market is betting that millions more people in the U.S. are going to be covered by payers and that the infusion of revenues from these new market participants will lead to growth for the segment, though questions about profitability remain.
As a result, U.S. payers showed strong overall TSR of 21 percent during the period from 2010 through the second quarter of 2013. Among the drivers of value creation during that period, improved investor expectations constituted the strongest factor, followed by solid sales growth and moderate changes in the number of net shares. These factors likely reflect a confluence of several trends: growing confidence that the net impact of reform on growth would outweigh the pressure on margins in the long run, thus easing medical-cost inflation, and a focus on reducing administrative costs. Interestingly, payers posted the lowest variation in TSR among the three segments, indicating that the market might see less differentiation in the strategies and relative performance among the leading payers compared with the broader uncertainty in the market.
Yet while recent TSR performance has been strong—and top-line-growth projections are promising—there is a real question as to how changes in product offerings and channels may play out. How many companies will shift their employees to the public exchanges, and how quickly? Will private exchanges catch on, and how will they affect the financial model for risk-based business? What are the implications for relative advantage as products become more standardized on public and private exchanges? Among all of this uncertainty, the market seems to believe that growth from new lives entering the market could override the margin pressure and that sustained cash flow will be able to fund share buybacks and sustained dividend increases.
In such an environment, payers will need to adapt to a more price-sensitive market, where more lives are funded or subsidized by government programs, individual members have more influence over their choice of health plan, and medical-management strategies are more critical than ever to keep cost inflation in check. Specifically, several imperatives stand out for U.S. payers:
Follow Shifting Profit Pools
As health care reform is implemented, with new lives entering the market and employers reacting to incentives, all payers need to find their ideal market exposure—meaning a portfolio of “profit pools” that ensure growth, margins, and manageable volatility, and to which the payer’s current operating model is best suited. If that does not provide enough growth, some payers may need to modify their business model to win in the most attractive profit pools.
Improve Medical-Management and Operating Strategies
In the context of greater competition and price sensitivity and the shifting provider landscape, U.S. payers will need to develop new care models and reimbursement systems if they are to improve their medical-cost position.
Fundamentally, this requires innovation and a new way of thinking about how patients receive care, in order to shift from a fee-for-service model to one that is based on outcomes. For example, payers can collaborate more directly with providers of care and revisit assumptions about which components of care management are best handled by providers. Payers can focus on preventive care and wellness and better educate patients regarding lifestyle choices, all of which would reduce per-patient expenses over the long term. Other advanced patient-care models include risk-sharing reimbursement schemes, integrating care more effectively among multiple providers, and developing sophisticated approaches to home care. (See Alternative Payer Models Show Improved Health-Care Value, BCG Focus, May 2013.) In a VBHC environment, payers have a real opportunity to differentiate themselves by enhancing the patient experience, improving outcomes, and reducing costs for specific patient groups.
Pursue M&A to Diversify Revenues and Improve TSR Performance
We anticipate that most U.S. payers will continue to acquire competitors in order to accelerate growth, gain access to capabilities, and achieve greater scale. As a larger share of revenues comes from the government, many will also need to diversify and develop complementary revenue streams and profit pools, in order to insulate margins from regulatory and reimbursement risk.
For example, companies that handle Medicare patients have benefited from substantial growth in volume recently, and the Medicaid base shows similar prospects. Medicare shows the most attractive long-term outlook based on growth potential and the size of the potential market. (Some 8,000 baby boomers turn 65 and become eligible for Medicare each day in the U.S.)
That said, the sustainability of this growth is still questionable, and these players face significant volatility from the actions of the U.S. government, particularly as it seeks to address its fiscal issues. From 2010 through 2012, UnitedHealth Group and Humana were among the top performers in the payer segment, thanks to their focus on Medicare populations. However, in 2013, both companies suffered from expected pressure on the federal government’s reimbursement for Medicare Advantage patients.
By comparison, companies like Cigna—with a larger portion of its business driven by international covered lives—were partially insulated from this volatility. In fact, UnitedHealth Group’s recent acquisition of Amil Participações of Brazil made strategic sense largely because it provided the company with 4 million new covered lives and diversified the company’s revenue base, giving it some ballast against potential volatility from the reimbursement decisions of the U.S. government.
Results and Imperatives for Secondary-Services Providers
Secondary-services providers posted the lowest TSR (9 percent) among the three segments in our analysis. They also showed the highest variance in TSR performance, a reflection that this segment includes a very diverse group of companies, operating in a wide range of businesses and locations.
Sales growth was the main driver of TSR, particularly through M&A, and margin and multiples were a net drag on TSR. Regarding margin erosion, the secondary-services market has become fiercely competitive. There are often low barriers to entry, and providers have begun passing their cost pressure directly through to secondary providers. In turn, these trends have reduced investors’ confidence that these companies can continue to create value.
Moreover, during the period from 2010 through the second quarter of 2013, the segment’s TSR performance was significantly swayed by a single company, Express Scripts, which is by far the largest company in the segment (with a market cap of roughly $50 billion) and whose TSR was affected to a large extent by its $29 billion acquisition of Medco Health Solutions. Excluding Express Scripts, the TSR of the remaining group was 7.6 percent, and performance was still characterized by strong contributions from sales growth and investor expectations.
In light of the segment’s value-creation performance, several imperatives stand out:
Focus on Key Strengths in Differentiated Business Models
As for providers of care and U.S. payers, operational focus is becoming critical for secondary-services providers. In the VBHC world, they must differentiate themselves from the competition and ensure that they offer services and products that help care providers improve outcomes in a transparent fashion. Secondary providers with leading market positions—in either a particular market or a particular service offering—can leverage that to ensure their relevance with payers, providers, and patients and thus drive better results and margins.
Manage the Interfaces Among Other Players
In addition, secondary-services providers must determine how best to thrive in a more interconnected health-care environment. As discussed previously, both payers and providers will be looking to collaborate more directly, with richer exchanges of information and more sophisticated analyses of both costs and outcomes. Given this shift, secondary providers must manage the interfaces among all relevant players. Figuring out their precise role and how they can facilitate the right information flow along the entire value chain will be critical for maintaining growth and profitability.
Look for Profitable Growth Opportunities
Emerging markets may be the solution for some secondary-services providers. Others may find attractive growth by expanding into adjacent categories, in order to diversify their revenue streams and create new sources of growth. In all cases, the company’s growth strategy must align with its key strengths.
In sum, the health-care-services industry is at a clear junction between the fee-for-service model of the past and the VBHC model of the future. Providers of care, payers, and secondary-services providers that can adjust their strategy and operating model accordingly will give themselves a clear competitive edge, ensuring that they continue to create value for investors in a sustainable fashion. Those that cannot, by contrast, will languish. For management teams, the message is clear: success lies within their control, provided that they move quickly to adapt to the shifting market dynamics and profit pools of the new health-care market.
Appendix
This report builds on BCG’s fifteenth annual Value Creators report. It ranks the TSR performance of the top health-care-services companies for the period from 2010 through the second quarter of 2013. To create our company set, we included all companies that were publicly listed for the period studied, with at least 25 percent of their shares publicly traded. We also imposed a minimum market cap of $1 billion. The rankings track performance in local currency. For companies that are listed on exchanges outside their home country, returns were calculated in the currency of the exchange. The 38 companies in the sample are listed below. (For a list of the top ten companies by TSR performance over the period we analyzed, see the exhibit.)
Aetna
Air Methods
Apollo Hospitals Enterprise
Bangkok Dusit Medical Services
Brookdale Senior Living
Bumrungrad International Hospital
Cigna
Community Health Systems Professional Services
DaVita HealthCare Partners
Diagnosticos da America
Express Scripts
Healthcare Services Group
HealthSouth
HMS Holdings
Humana
Isapre Banmédica
KPJ Healthcare Berhad
Laboratory Corporation of America Holdings
LifePoint Hospitals
Magellan Health Services
Mediclinic International
Mednax
Netcare Access
OdontoPrev
Orpea Société Anonyme
Primary Health Care
Quest Diagnostics
Raffles Medical Group
Ramsay Health Care
Rhön-Klinikum
Ryman Healthcare
Ship Healthcare Holdings Company
Synergy Health
Tenet Healthcare
UnitedHealth Group
Universal Health Services
WellCare Health Plans
WellPoint
Acknowledgments
The authors would like to thank Kerstin Hobelsberger, Philippe Dehillotte, Joachim Engelhard, and Carolyn Noble for their insights, as well as Joe Brilando from the BCG ValueScience Center in San Francisco, a research center that develops leading-edge valuation tools and techniques for M&A and corporate-strategy applications.


