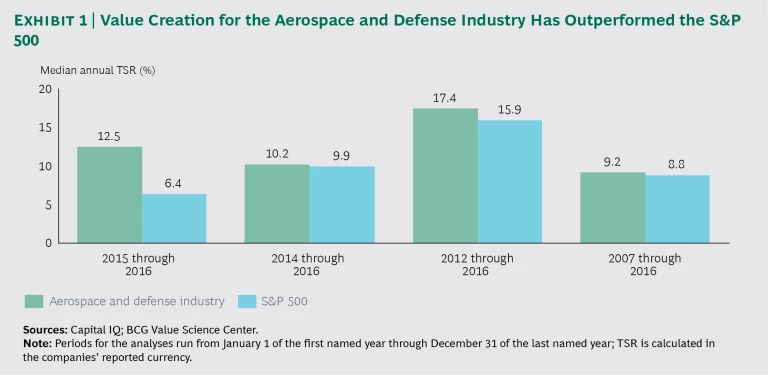
The aerospace and defense (A&D) industry has generated extremely strong value for investors over the past decade, consistently outperforming the S&P 500. That value has primarily come from sales growth, although improved profit margins have made a secondary contribution. In the past year, defense contractors have continued to show strong growth, but the commercial aerospace sector appears to be leveling off as new orders slow.
Each year, The Boston Consulting Group analyzes the total shareholder return (TSR) of various
While the industry’s overall performance is strong, companies must be relentless in identifying growth opportunities if they are to continue that success. They must also reduce costs throughout the supply chain.
Commercial Aerospace Slows
The results of our value-creation analysis largely track the findings from a similar study conducted in 2015. (See Aerospace and Defense Value Creators Report 2015, BCG report, June 2015.) That study found that A&D companies had outperformed the broader market—which remains true today. For the past two, three, five, and ten years, the median A&D company has outperformed the S&P 500 in TSR. (See Exhibit 1.)
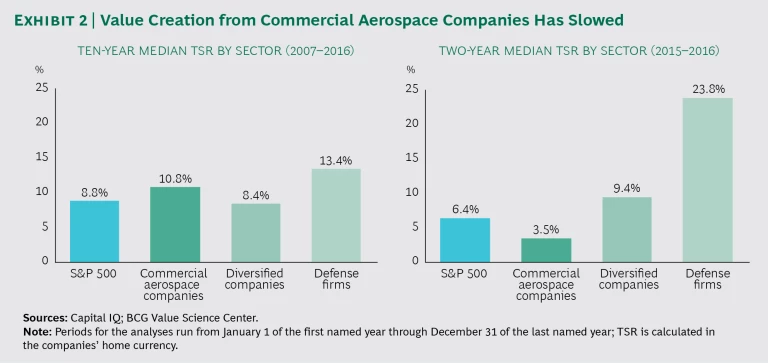
In the 2015 analysis, however, which looked at performance through the end of 2014, commercial aerospace contributed significantly to overall value creation for the A&D industry. Over the two years since then, the commercial sector has created less value, owing in large part to investor expectations of slowing growth. Commercial OEMs are working through record-high order backlogs, and both Boeing and Airbus have increased production rates for key platforms (the B737 and A320 families, respectively). Orders for new aircraft continue to come in, but investors see this growth slowing and are giving these companies’ stocks lower valuation multiples. As a result, the median TSR performance for commercial aerospace companies declined over the two-year period of 2015 through 2016, to 3.5%—a significant drop from the TSR of 11.5% for the period from 2007 through 2014.
Spending on Defense Booms
In contrast, defense contractors showed continued strong average annual TSR, averaging 23.8% over the past two years. (See Exhibit 2.) The defense segment has benefited from a political swing toward increased defense spending. In the US, the Trump administration has pushed for larger Defense Department budgets, with a particular boost in areas such as shipbuilding. Those budget allocations still need to be approved by Congress, but industry watchers expect a defense buildup. (See “More for Less: What Government and the Defense Industry Need to Do to Meet the Trump Administration’s Aspirations,” BCG article, February 2017.)
In the past, diversified A&D companies performed worse than specialists that focus on either commercial aerospace or defense. For the past two years, however, diversified companies have performed better than commercial companies, with an average annual TSR of 9.4%.
Growth Remains the Biggest Contributor to Value
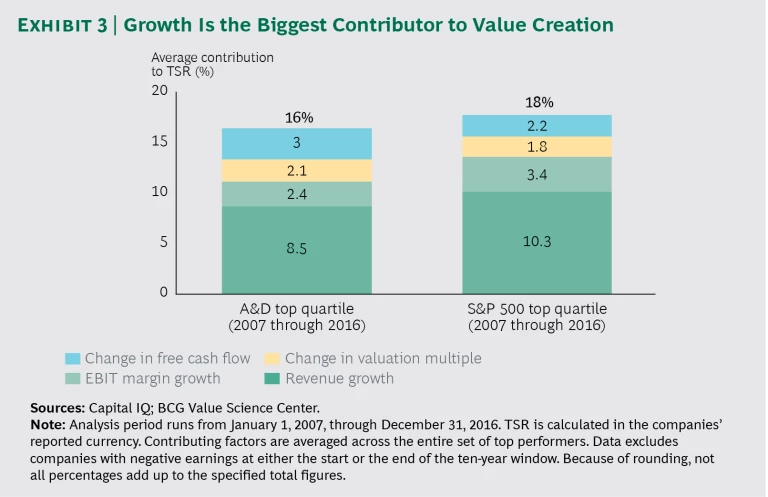
Another similarity between the analyses in 2015 and this year is that sales growth is still the dominant factor in creating value. For the top quartile of performers, 53% of TSR (8.5 percentage points) comes from revenue growth—a figure largely in line with data for the S&P 500. (See Exhibit 3.)
The growth imperative is manifesting itself in the market, as companies try to increase their size and scale through M&A activity. For example, Rockwell Collins bought B/E Aerospace, and Lockheed Martin acquired Sikorsky. In a commercial environment in which orders are slowing, corporate leaders need to identify new sources of growth. These may take the form of organic moves into adjacent markets, or inorganic moves that lead to accretive top-line growth.
Margins Are Higher for Suppliers Than for Prime Contractors
Profit margins are another major contributor to value. As in the past, margins are stronger among tier-one and tier-two suppliers than among the prime contractors they sell to. We recently looked at this dynamic in the commercial aerospace segment. (See “Can Airplane OEMs Increase Their Share of Profits?” BCG article, October 2016.) The reasons for stronger supplier margins include a constrained supply base, much greater exposure to the highly profitable aftermarket, and disproportionately high development costs borne by prime contractors.
In fact, the farther down the value chain a company sits, the higher its margins. Over the past two years, EBIT margins for tier-two and tier-three suppliers have averaged about 17%, compared to about 14% for tier-one suppliers and just 9% for OEMs. Not surprisingly, suppliers outpace prime contractors on long-term TSR as well.
To continue delivering strong value, companies in all segments need to improve their margin performance. One common—and effective—approach involves reducing costs along the supply chain. To that end, some firms have switched suppliers or brought the manufacturing of certain components in-house. Boeing changed its supplier of landing gear for the B777X from UTC to Héroux-Devtek, and it now handles the production of wings for that airframe, along with nacelles for the B737 MAX. Such measures give contractors critical negotiating leverage with their suppliers, with the objective of reducing supply-chain costs and improving margins.
Shedding Assets Does Not Increase Productivity
The TSR data also casts light on a recent trend in the industry, in which OEMs shed assets in hopes of becoming leaner. For example, Boeing designed its 787 platform to take advantage of a network of outsourced suppliers around the world. Contrary to widespread belief, reducing assets does not automatically lead to greater productivity. In fact, firms that are in the middle of the pack in terms of asset intensity (defined as gross fixed assets as a percentage of revenue), show the highest return on net assets. It might seem that having fewer assets should allow companies to squeeze those assets dry, but business models that possess some level of asset intensity also commonly have barriers to entry, leading to higher potential returns.
Implications for A&D Leaders
The findings drawn from this analysis, combined with recent developments within the A&D industry, point to several strong recommendations for management teams.
Relentlessly seek sales growth. Across segments and over nearly all time periods, companies create the bulk of their shareholder returns through sales growth. That fact has different implications for different segments.
Leaders of commercial aerospace companies need to identify new growth opportunities in an environment where production rates have recently increased and order backlogs will soon decline. By investing in specific capabilities, companies may be able to tap into organic growth. But M&A needs to be on the leadership agenda, too.
In the defense segment, while the Trump administration has emphasized increased military strength, companies need to make sure that they are well positioned in key markets that are likely to grow. Opportunities for organic growth exist outside the US as well, but leaders must be selective in identifying and pursuing them.
Invest in digital capabilities. A key component of the growth agenda for both commercial and defense firms is digital technology. To leverage the technology and create new streams of revenue, some companies will incorporate digital components in existing offerings, while others will create entirely new data-driven product offerings. For example, Thales is developing digitally integrated cockpits that incorporate big data and machine learning to anticipate potential issues for pilots, such as rerouting or runway changes due to hazardous weather.
Improve margins. Companies need to maintain their focus on operating margins. For prime contractors, the goal is to structure supplier relationships in a way that leads to greater leverage in pricing negotiations, perhaps by switching suppliers or bringing some component manufacturing in-house. For tier-one and tier-two suppliers, the objective is to build sustainable, high-margin positions, particularly in the aftermarket.
Determine the right asset intensity. Finally, management teams need to reassess their balance sheets to determine which assets to shed and which to retain. Rather than pushing to reduce assets for the sake of a smaller balance sheet, they need to perform the analysis and identify the assets that create sustainable returns, contribute to a defensible market position, and support a high-margin business.
Regardless of the particular strategy a company pursues to create value, a dispassionate, data-supported approach is essential. Some widely held beliefs about the A&D industry are simply not supported by the facts. The market will justly reward companies that truly understand the varied ways of generating returns for shareholders.


