Cities with forward-looking mobility systems have two big, primary goals: to expand access for all residents and to end the supremacy of single-occupancy vehicles (SOVs). When access is easy, convenient, and equitable, cities gain in wealth and the well-being of residents. And when most travel doesn’t mean one person traveling alone in a car, especially a gasoline-powered car, cities are less congested, less polluted, and less likely to perpetuate patterns that deny certain residents and neighborhoods access to jobs and other opportunities. These words—variously attributed to either Gustavo Petro or Enrique Peñalosa, both former mayors of Bogotá—are a veritable urban mobility proverb: “A developed country is not a place where the poor have cars. It’s where the rich use public transport.”
Imagine the gains in economic opportunity and social integration, healthier air, and travel time saved. But questions remain: Is it possible to achieve both economic growth and greater equity? To ensure people’s freedom of movement while working together to save the planet? To preserve a city’s character and plan for the future? Our research explored these choices.
The goals are lofty yet vital for the future well-being of cities. As a starting point for improving urban transportation and mobility, we have built the BCG Accessibility Index to measure mobility performance across cities and to provide a detailed view of the mobility patterns within a city’s borders. These insights can help leaders identify the issues unique to their city and implement the solutions most likely to yield greater wealth and health. In this article, we explain the index, the issues, and the initiatives that cities must undertake.
A New Measure of Mobility
Our objective was to assess the performance of mobility systems by measuring access to opportunities within a city using a location-based approach. Our two main guidelines: the measure should be easy to understand, and it should allow a meaningful comparison between cities around the world and among areas within cities, regardless of the mobility modes available. We defined two metrics:
- A Zone Accessibility Index. This shows, for a given urban zone or subzone, the percentage of the city’s inhabitants and of jobs in the metropolitan area that can be reached within a certain amount of time (for example, 30 or 60 minutes) using a car or public transit at peak travel times.
- A City Accessibility Index. This is the average of the accessibility indexes of all the zones or subzones, weighted by the population of each one. It measures the percentage of the city’s inhabitants and of jobs in the metropolitan area that can be reached within a certain amount of time on average per inhabitant.
Our Accessibility Index relies on a unique assemblage of public and private data. We used population and job location data from offices of national statistics, and we simulated travel times by leveraging both APIs from private sources and General Transit Feed Specification (GTFS) data from various public-transport operators. Working with BCG’s specialty business Gamma, which focuses on advanced analytics and data science, we developed an algorithm that, when applied to the proprietary dataset, allows us to capture the performance of the road infrastructure (for cars but excluding buses) and of the public-transport infrastructure (trains, subways, buses) in an urban area, with a precise mechanism designed to track the time it takes to reach other areas and jobs using various means of transport in and around cities. The Accessibility Index can also be used to measure access to resources like education and health care.
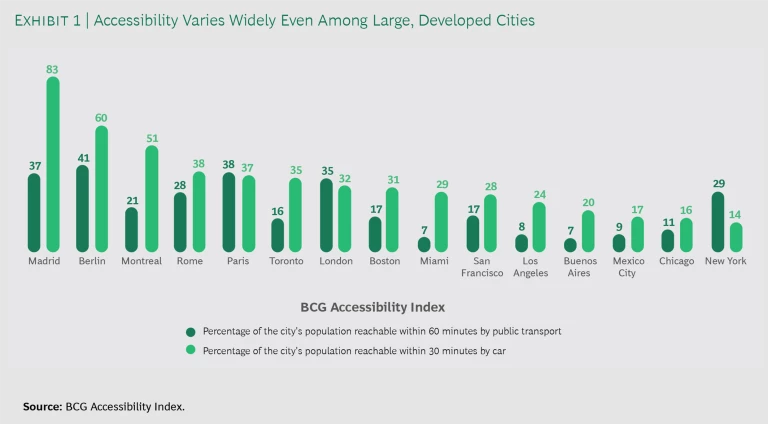
Our research reveals that accessibility, even among large, developed Western cities, varies widely. For example, on average, someone in Berlin can reach 41% of the city’s inhabitants within 60 minutes using public transit, but someone in Miami can access just 7% of that city’s inhabitants via the same mode within the same amount of time. (See Exhibit 1.)
In addition to differences across cities, we observe large differences within cities. For example, in Greater Paris, people in areas with the greatest accessibility can reach approximately 60% of others in the metropolitan area in 60 minutes using public transportation, while those in areas with the least accessibility can reach only about 25% within the same time frame.
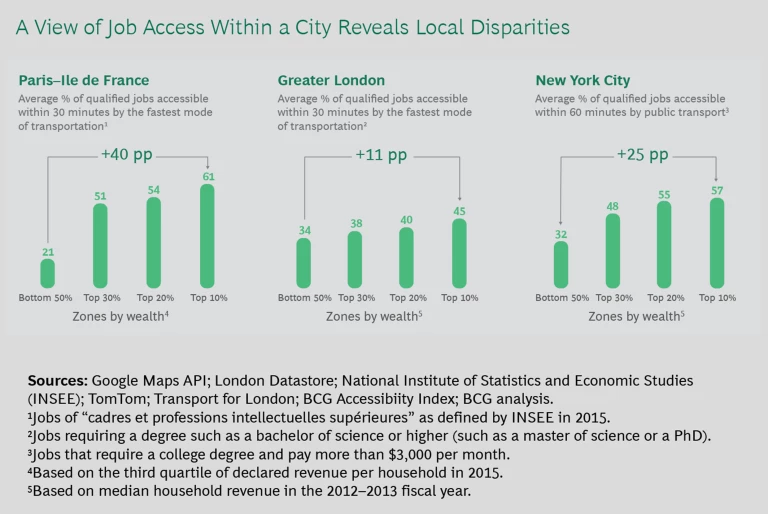
For cities with available job location data, we can also map access to jobs by public transit and by car. In London, for instance, the Accessibility Index revealed that the wealthiest people, on average, have access to 45% of jobs in 30 minutes using the fastest mode of transportation, while the poorest people have access to only 34% of those jobs within the same time frame using the fastest mode. This type of analysis can enable public authorities to focus their transport development policy on the most underserved populations and areas, and thus help to provide a more egalitarian and therefore a more prosperous framework for the local economy.
Accessibility = Wealth + Equality
As cities look to redesign their transportation futures, measuring urban mobility performance is a crucial first step in gaining a deeper understanding of the challenges and choices that lie ahead.
The next step is to understand the impact of that performance. To do that, planners must recall the “travel time budget,” established in the 1970s by Yacov Zahavi, an Israeli engineer who discovered that the amount of time people spend on travel each day is constant over time and across geographies. For generations, city inhabitants have spent a daily average of 1 hour 20 minutes in travel, with distances expanding as the means of transportation grow (with improvements to infrastructure, development of a transit network, and the recent addition of new mobility options like ride hailing and bike and scooter rentals) and with destinations growing in number as accessibility rises.
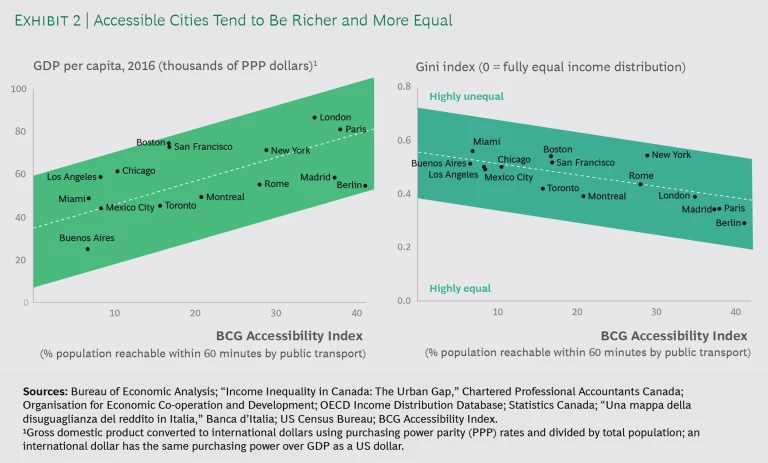
Taking into account this fundamental constant, our measures of cities’ accessibility have brought to light two crucial findings: better transportation system performance increases the wealth of a city, and it reduces inequality within a city. Because people travel the same amount of time every day, improving accessibility means that they can travel to new and more destinations every day. As a result, they will have new opportunities—for jobs, education, business relationships, health care, shopping, social gatherings, and more—which, in turn, will bring greater wealth and well-being to the city and to those who live and work there. (See Exhibit 2.) Likewise, the less adequate the transit system, the larger the number of missed opportunities and the lower the quality of life.
In other words, an improved transportation system creates a unique dynamic that can end the vicious circle that too often leaves poor people stuck in isolated areas, unable to reach the schools and jobs essential to lifting them out of poverty.
Another consideration is the shift to remote learning and working that has occurred during the COVID-19 pandemic. This increase in accessibility, brought about not by improved mobility but by digitization, is likely to continue, at least to a degree. But it is not available to everyone. While it may be an option for wealthier students and white-collar workers, poorer students and blue-collar workers will still rely on mobility to bring them to school and to work.
SOV Supremacy = Congestion + Pollution + Inequality
The third step in understanding the impact of an urban mobility system’s performance is to look at the relative use and effectiveness of public transit and driving in delivering accessibility. The Accessibility Index shows that driving offers better access than public transit in almost every city in our study, as shown in Exhibit 1.
This situation strengthens SOV supremacy. And if individuals continue to travel alone in cars, traffic congestion, pollution, and the accessibility gap within urban areas will grow, especially in cities where residential areas are far from industrial and economic clusters.
Hope that the digital revolution would solve the accessibility-related challenges faced by cities worldwide has waned. Market forces and human behavior have made it hard to move away from the traditional car-centric mobility to a new, more sustainable system. The new ride-sharing services, touted as a breakthrough incentive to renounce car ownership, are building their businesses by maximizing their own assets on the ground and the number of rides that they sell. Rather than contributing to better overall urban mobility, their goal is to multiply the miles covered by their participating vehicles, often at the expense of public transit. A recent study from the Union of Concerned Scientists showed that ride-sharing companies such as Uber and Lyft are responsible for 70% more pollution than the personal-car trips that they displace.
The upshot: there are more cars on the road than ever.
The Archetypes of Urban Mobility
Transforming the urban mobility paradigm starts with understanding the status quo. Each city is different, and each transportation improvement must be adjusted to the local reality. For instance, although car use dominates in every city, its impact does not manifest in every city in the same way.
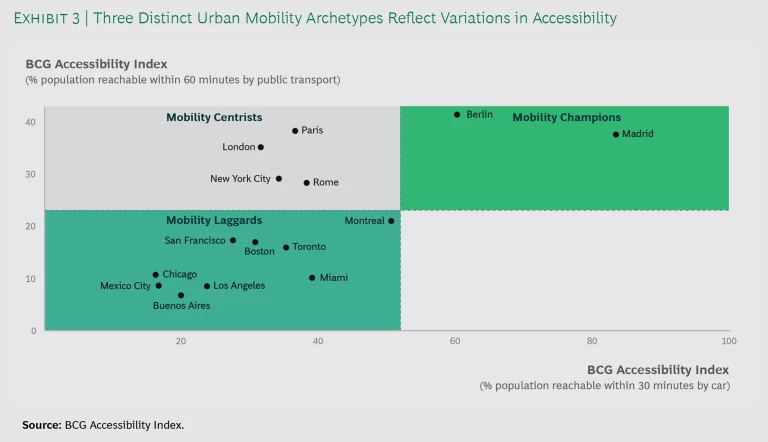
We have divided the 15 cities that we mapped using the Accessibility Index into three distinct urban mobility “archetypes.” (See Exhibit 3.) Further research reveals some of the variables that underlie these archetypes, giving us a general idea of what cities are contending with and why. In some cases, we see evidence that cities’ efforts to control the mobility mix are paying off. It may be too early to say that these approaches are tried and true, but they certainly point the way.
Here’s a deeper look at the three archetypes:
- Mobility Champions. Berlin and Madrid stand out because of the outstanding accessibility provided by both their public-transit and their road infrastructure systems. This aligns with policies and initiatives that were recently established in both capital cities. Berlin, which already had a dense suburban train and underground network and a strong bicycle culture, has shown its capacity for mobility innovation by regulating ride sharing and by launching an on-demand transit service that complements public transit in the city center. Madrid implemented a ban on older cars that could not meet new antipollution standards and restricted access to the city center to drivers with private parking spots and those who register for parking in advance. These measures have reduced congestion while increasing quality of life.
- Mobility Centrists. New York, London, Paris, and Rome rank high in accessibility by public transportation: 25% of the inhabitants of these cities can be reached within 60 minutes. But this masks the relatively poor access possible by car in these cities (due to inadequate road infrastructure), as well as stark inequities across neighborhoods. All of these cities have very dense centers where the wealthy live and qualified jobs are located, and there are large discrepancies in accessibility and mobility system performance between the richest and poorest areas. (See “A Closer Look at Mobility Centrists.”)
A Closer Look at Mobility Centrists
In Paris, for example, we found a wide disparity between the share of qualified jobs (61% versus 21%) that residents in the wealthiest and poorest areas are able to reach within 30 minutes using the fastest mode of transportation. (See the exhibit below.) In London, access to good jobs is lower overall relative to other Centrists, but the gap between the share of jobs accessible to people in the richest and poorest areas is less extreme (45% versus 34%). Although New York, London, and Paris rank high on public-transportation accessibility, they suffer from large inequalities that force people living in the suburbs to commute to work by car.
- Mobility Laggards. Most large North American metropolitan areas have very low public-transit accessibility, leaving their inhabitants almost completely automobile dependent. Typically, the poor performance of the public-transport system in these cities provides no credible alternative to SOV supremacy; as a result, these cities face very high levels of congestion and pollution, which spread into the outlying suburban areas. Waging war on the single-occupancy car is not an effective way out of this situation. Los Angeles, like California at large, has tried this approach, notably by developing an extensive network of high-occupancy-vehicle lanes. Experience has shown, though, that HOV lanes are underutilized and that the savings in travel time do not create a significant incentive for people to carpool. Such isolated measures against SOVs do not provide a sufficiently robust framework to overcome car supremacy, just as carpooling alone is not an adequate mode of urban transport but must be complemented by efficient public transit.
As part of a city’s mobility strategy, a Mobility Laggard can become a Mobility Centrist, and a Centrist can become a Champion.
The empty quadrant at the lower right of Exhibit 3 speaks volumes. It is essentially impossible for a city to occupy this space, because to do so would require a web of roads occupying a great deal of public space, which would render the city devoid of character and quality of life. And though it might seem paradoxical, studies have shown that building more and bigger roads does not solve congestion problems; according to the law of induced travel demand, they simply create more space for more cars and ultimately more congestion—or another victory for SOVs over safer, healthier, more equitable forms of
Is it possible for a city to move among quadrants—to improve accessibility and change the archetype to which it belongs? Yes. Ultimately, as part of a city’s mobility strategy, a Mobility Laggard can become a Mobility Centrist, and a Centrist can become a Champion.
How do we get there?
The Way to End SOV Supremacy: A New Urban-Mobility Framework
To transform the urban-mobility paradigm, cities need to take the lead. They must establish the right regulatory framework to enable innovative mobility solutions that increase access and thereby have positive economic, social, and environmental effects. And they must shape mobility operations, experimenting with new solutions and monitoring mobility behaviors to ensure that private operators and riders are properly incentivized to switch from individual cars to shared and green modes of transportation. In other words, local public authorities should orchestrate the whole mobility ecosystem.
Consider the situation of the cities that are now classified as Mobility Laggards. To improve their mobility performance, they must initially focus on strengthening their public-transport systems. Bringing a certain level of efficiency and modernity to the infrastructure is a prerequisite, but investing massively in traditional public-transit infrastructure is probably not the most efficient way to tap the full potential of the current public network—it’s an expensive, lengthy, and inflexible process. Building new metro lines or stations entails years of planning, negotiation, and related friction, and does not always lead to an overall increase in accessibility.
Instead, Mobility Laggards seeking to up their game and enable commuters to enjoy the full potential of the city’s public-transport network can make use of new options—just as we have seen our Mobility Champions do. These options are available to all cities, but they hold particular relevance for Laggards, whose first priority is to put in place alternatives to SOVs. These cities can couple their efforts to emphasize public transport with the use of modes that are less costly and more nimble. For instance, they can supplement public transit with micromobility alternatives, such as free-floating bicycles, and solutions that encourage increased utilization of vehicles on the roads, like car sharing. Cities can take different approaches to developing these options. They can work together with private operators to define a target offering, or they can subsidize or facilitate the implementation of alternative modes through regulations and support of pilot initiatives.
To transform the urban-mobility paradigm, cities need to take the lead.
With micromobility, on-demand transit, and car sharing in place, any city will likely score high on the Accessibility Index. But that does not mean people will move away from SOVs. Cars could still remain the most efficient and convenient means of transport. Therefore, in order for Mobility Laggards to become Mobility Centrists and, ultimately, Mobility Champions, they will have to take further steps to induce change and end SOV supremacy.
The challenge is twofold: to increase the cost of traveling alone in a car and to improve the attractiveness of alternative transportation modes.
Cities can increase the costs associated with SOVs. For instance, they can institute dissuasive measures like congestion pricing and limits on the number of taxis and ride-hailing vehicles on the road. But unless alternative modes of transport are sufficiently attractive—offering satisfactory speed and convenience—commuters will likely opt to absorb the increased expense of travel by SOV.
To improve the appeal of alternatives, cities will need to work with other mobility players. It will require a fully integrated mobility-as-a-service transit system that includes a digital platform, access to the latest mobility offerings, incentives, and measurement tools to ensure that all transport services are running at full efficiency. The objective is not to build some kind of single-transport “killer app,” but to fully integrate and orchestrate all available services, from incentives to travel planning to pricing to ticketing. This will involve increasing integration across the burgeoning modes of mobility and making sure that providers can collect all the data they need to establish policies and travel options that will push commuters toward more environmentally sound travel modes.
While it is mainly the responsibility of public authorities to develop such a comprehensive urban mobility framework, private players, too, must understand both the value at stake and the underlying market possibilities. Together, public and private operators can unlock tremendous value by creating mobility coalitions that benefit the economy and community at large. In this way, the seemingly undesirable tradeoffs that have hobbled urban accessibility efforts in the past can be productively addressed—and economic growth achieved in tandem with greater equity. Freedom of movement can coexist with efforts to save the planet. And a smart urban mobility framework can preserve a city’s character and lay the groundwork for the future.
This article is the fifth in a series on the future of mobility. In subsequent publications, we will explore other options available to cities and new-mobility operators, drawing on the findings of our research. We welcome the input and participation of cities and private players.


