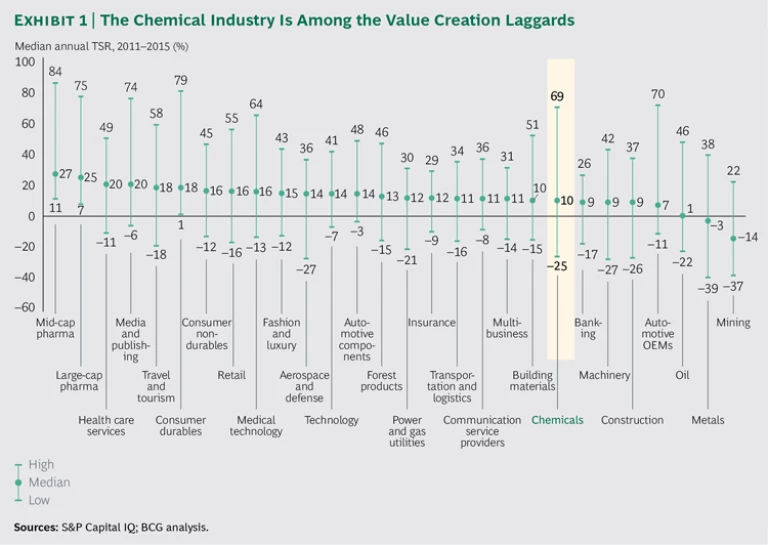
The chemical industry was once a top value creator, generating a five-year total shareholder return (TSR) above that of every other industry in BCG’s annual Value Creators ranking. Today, the industry is one of the more challenged. Its median TSR from 2011 through 2015 was 9.5%, considerably below the 12% median of the 28 industries we tracked. (See Exhibit 1.)
Yet some chemical companies have been able to adapt, developing differentiated business models and generating excellent returns. Indeed, we find an enormous disparity between the best and the worst performers of the 189 chemical companies in our global sample: a spread of 94 percentage points, larger than the spread in any other industry in our study. This disparity indicates that the chemical industry has become a territory of extremes.
We believe that these extremes reflect a fundamental industry trait: chemical companies have multiple distinct options in their choice of business model—each with its own outlook for growth and profitability. This is true not only for the industry as a whole but also for subsectors and individual clusters. In fact, the choice of business model may determine the performance of a company more than any other top-management decision.
Several trends have also affected the performance of chemical companies around the world in the past five years. These trends have shifted value creation among regions and from commodity-driven business models to specialty-chemical-based business models. Among the trends we have observed, the biggest impact has come from the shale gas revolution, the cooldown of Chinese GDP growth, overcapacity in China, rising GDP growth in South and Southeast Asia, and a move toward higher-end chemical products in China.
Regional Performance Still Varies Widely
The difference in TSR performance among regions was not as great from 2011 through 2015 as it was during the previous five-year period, yet we still observe striking regional—and subregional—variation. A primary reason is that chemical companies typically have a strong position as suppliers to local industries—such as automotive in Germany, electronics in Japan and South Korea, and cosmetics in France. Despite the chemical industry’s global footprint, therefore, many companies are heavily affected by their local economies and the types of industries that flourish in them.
Separately, exposure to the emerging markets and Greater China (which in our analysis includes People’s Republic of China, Hong Kong, and Taiwan) has also had a tremendous impact. Of the 99 companies not headquartered in the emerging markets and Greater China that reported their revenue share by region, the ten with the lowest share in emerging markets attained a healthy average TSR of 20%. In contrast, the ten companies with the highest revenue share in emerging markets realized a TSR of only 5.3%, well below the 10.6% average for this group.
We find that companies that earn a high proportion of revenue in emerging markets have been challenged by three factors affecting value creation: advantaged local competitors, the difficulty of establishing a high-performance commercial organization in many emerging markets, and the price sensitivity that is common among customers in these markets. Only companies willing to reconsider the emerging-markets business model and develop locally competitive offerings have an opportunity to succeed—and gain positive returns on the enormous investments they have made.
How Chemical Subsectors and Clusters Performed
To better understand the multifaceted landscape of the chemicals industry, we have divided it into five subsectors and about 150 segments within those subsectors. For our 2016 analysis, we have grouped these segments into 18 clusters. While some companies are active in multiple clusters, we have allocated, as far as possible, each of the 189 companies in our sample to the cluster in which it generates the majority of its revenue. We have also created a “diversified” cluster within the multispecialty subsector in recognition of the fragmentation of some companies’ portfolios, especially in that subsector.
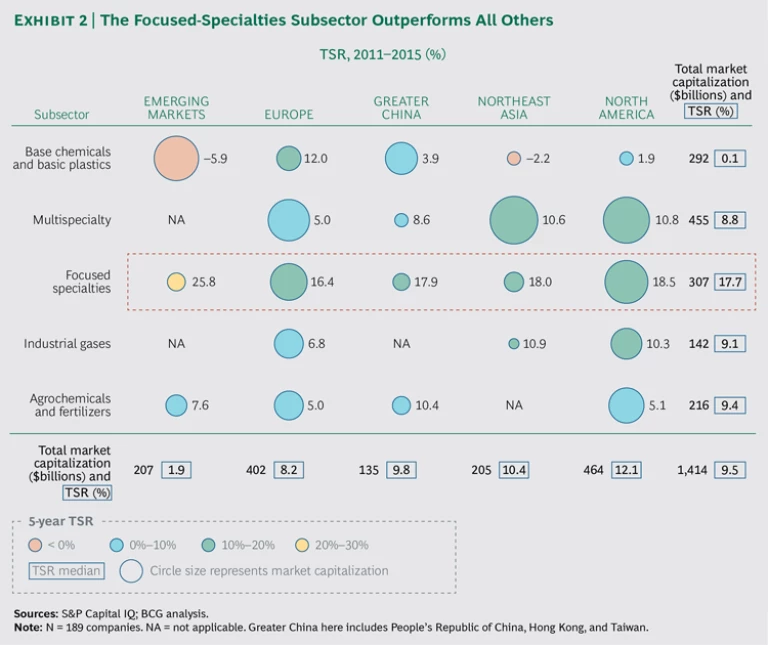
In this year’s report, we examined the following chemical subsectors and clusters (see Exhibit 2):
- Base Chemicals and Basic Plastics. The 41 companies in this subsector realized a median five-year TSR of 0.1%, although in Europe the TSR was 12.0%, above the overall industry median of 9.5%. The four clusters in this subsector had the lowest TSR of all chemical clusters.
- Multispecialty Chemicals. The 53 companies in this subsector realized a five-year median TSR of 8.8%, slightly below the industry median. The subsector underperformed the overall industry in Europe and in China but performed slightly better than the industry in North America and Northeast Asia. The multispecialty chemicals subsector comprises three clusters: diversified materials, diversified additives and functional materials, and broadly diversified chemicals. The first two achieved TSRs of 10.1% and 12.0%, respectively. The third cluster realized a TSR of 7.5%.
- Focused Specialties. This subsector, which consists of 55 companies, clearly outperformed the rest of the industry over the past five years, generating a median TSR of 17.7%, nearly twice the industry median. In fact, focused-specialty chemical companies outperformed all other subsectors in all regions. Of the eight clusters in this subsector, six were at the top of the TSR ranking, and only one was below the industry median.
- Industrial Gases. This highly consolidated subsector comprises just eight companies. The five-year performance was slightly below the industry median.
- Agrochemicals and Fertilizers. The 32 companies in this subsector suffered from the cooldown of commodity demand, achieving a median TSR of 10% as a result of the slightly stronger performance of companies headquartered in Greater China. Agrochemicals achieved a five-year median TSR of 10.3%, while fertilizers, particularly hard hit by a deterioration in potassium and phosphate prices, earned a median TSR of 3.5%.
The Chemical Industry’s TSR Stars
Even though the industry’s overall five-year TSR is below that of previous periods and ranks relatively low among the industries we tracked, some chemical companies are flourishing. In fact, when only the ten companies with the highest TSR in each subsector are considered, it becomes clear that the chemical industry has had some of the best five-year returns. The median TSR for the top-ten chemical companies was 40%, which would place this group sixth among the 28 industries we studied.
These top performers are headquartered in multiple regions. Perhaps not surprising, seven are focused-specialty chemical companies, while two are from the agrochemical subsector and one is a base chemical company. Although not all in this group have made similar business model choices, we see four recurring themes among them.
- Strong Serial M&A Capabilities. In past reports, we have pointed out that “always on” M&A has been a characteristic of many successful companies, such as those on our
top-ten list1 1 See <em><a href="/d/linkresolver/The 2012 Chemical Industry Value Creators Report Rebounding from the Storm" title="The 2012 Chemical Industry Value Creators Report: Rebounding from the Storm">Rebounding from the Storm</a>,</em> the 2012 BCG Chemical Industry Value Creators Report, May 2013, and <em><a href="/d/linkresolver/How 20 Years Have Transformed the Chemical Industry The 2013 Chemical Industry Value Creators Report " title="How 20 Years Have Transformed the Chemical Industry: The 2013 Chemical Industry Value Creators Report ">How 20 Years Have Transformed the Chemical Industry</a>,</em> the 2013 BCG Chemical Value Creators Report, June 2014. . In contrast, “single bet” M&A—a long spell of low M&A activity followed by a very large acquisition—has been a major source of value destruction. - Ability to Embrace Complexity. In an industry that produces about 40,000 distinct products, complexity is an ever-present concern. But some top performers seem to embrace complexity—even using it as a source of competitive advantage.
- Differentiated Business Models. Management teams tend to spend a lot of time in the quest for best practices, yet several of our top performers have developed successful business models generally considered to deviate from industry best practice. These business models have allowed companies to shield themselves from competition in a way that models more dependent on scale or proprietary manufacturing technologies would not.
- Tendency to Act Against Trends. A number of this year’s top performers seem to have acted deliberately against industry trends. Nippon Paint, for example, unlike most of its peers, expanded its position early in the fragmented Chinese refurbishment market for interior paint. As the new-construction market in China slows, Nippon’s strong position has created a significant competitive advantage for the company.
For large and diversified chemical companies, it may be more challenging to identify the kind of opportunities that have enabled the top performers to excel. Yet these four themes—strong, always-on M&A; the ability to build entry barriers based on complexity; distinct and differentiating customer-centric business models; and anticyclical tactics—should form the foundation of any business unit strategy discussion in diversified chemical companies.
Assessing Chemical Business Models
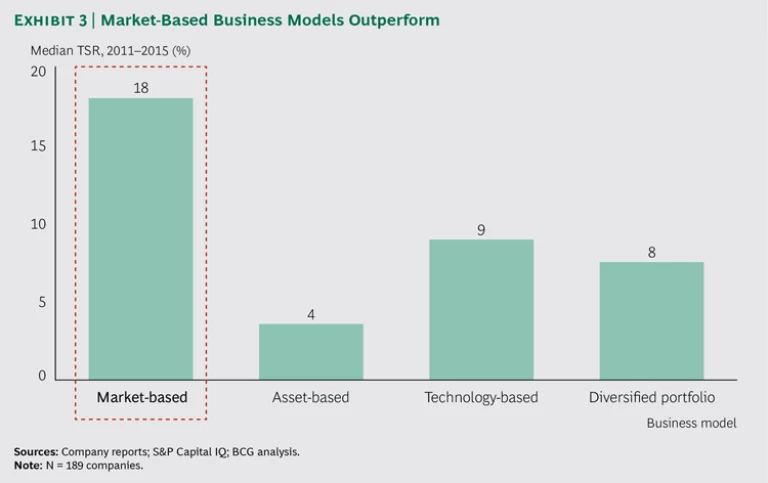
On the basis of our observation of the industry over the past year, we suggest that all chemical companies—across chemistries, subsectors, and even clusters—are applying one of four basic business models, each of which has yielded very different results. (See Exhibit 3.)
- Market-Based Business Models. This category includes all companies that focus on competitive differentiation based on customized solutions, advantaged distribution channels, superior technical-service networks, agile supply chains, or faster innovation cycles. Companies that predominantly follow such business models had a median TSR of 18% from 2011 through 2015.
- Asset-Based Business Models. This category comprises companies that rely on manufacturing scale, feedstock positions, superior capex management, or investment timing. Companies in this group had a fairly depressed median five-year TSR of 4%.
- Technology-Based Business Models. Companies in this category rely on differentiating manufacturing technologies such as process development capabilities, superior production and maintenance concepts, and catalyst research. These companies achieved a median TSR close to the five-year industry median of 9.5%.
- Diversified Portfolio. This category comprises companies with portfolios that contain a relevant and visible share of all three of the above business models. These truly diversified companies generated a median TSR of 8% for the five-year period.
The market-based business model offers lessons about superior value creation to the management teams of almost every chemical business. These lessons include the need to support—and even favor—smaller-volume, high-margin products as well as customized technology solutions, investments in small but flexible assets, rapid customer delivery, and the buildup of in-house sales organizations in midsize countries such as Indonesia and Colombia, not just in the largest markets, where every company has a presence. Each of these elements can create market-based advantages for any player.
For today’s companies, taking advantage of these lessons as well as those learned from our top TSR performers will often mean introducing new value-added offerings—offerings that come less from the identification of new molecules and more from the refinement or combination of existing ones. To do so successfully, they will need to continually rethink their position in the chemicals value chain and the focus of their R&D activities. Two possible challenges to this kind of refocusing include the following:
- New opportunities for value-added offerings often emerge at the edges of a company’s existing customer base. Sometimes the functional layer that will be in the best position to capture such opportunities is not well defined. In addition, executives often face the risk that new offerings will be seen by sales and other market-facing organizations as posing challenges to the current customer base rather than offering opportunities for growth and margin expansion.
- R&D organizations tend to focus resource allocation on existing, profitable core products and processes. New value-added offerings pose the risk associated with any new venture, and they may require additional scientific skills and other resources.
Time for Transformation
What lessons from our findings can help chemical companies shape their portfolios and business models? While boards and executives in the industry have accelerated the speed of divestitures and acquisitions in recent years, our data indicates that these actions have not automatically delivered the hoped-for results.
From our perspective, the best response is a continual rethinking and adjusting of the business model by the management team. One could believe that corporate transformation is a singular, massive event, or that transformation is primarily about changing the composition of the portfolio, but in our view both are incorrect.
In our view, the true differentiator is—and will be even more so in the future—the ability to have an always-on transformation mindset. Digitalization, emerging players, and feedstock price volatility are just a few of the reasons why chemical companies today need to reevaluate, reenergize, and continually adjust the boundaries of their activities, of their functional layers, and of their operating model.
We suggest two guiding practices to shape the transformation of chemical companies:
- Achieve business resilience. While key proprietary know-how about core chemical manufacturing processes was once a powerful and sustainable source of competitive advantage, proprietary knowledge is often less protected than it once was from both legitimate and illicit access by new competitors. We believe that new barriers to entry can be created by embracing a number of product varieties, customers served, and go-to-market approaches within one business. Being a frontrunner in the digitalization of processes and offerings is also an option for successfully embracing complexity as a source of competitive differentiation.
- Achieve portfolio coherence. The diversification of chemical companies’ portfolios remains a trigger for underperformance, given the real risk of resource misallocation. Divesting can be an option for improving value creation, but reducing diversity for its own sake is a risky move. Instead, we recommend creating a portfolio in which all businesses have similar success factors and a coherent set of capabilities. As market uncertainties increase and the pace of technological change accelerates, the strong link between a coherent set of capabilities and the business portfolio will be a key success factor in building a company's resilience.
Shaping the Portfolio in 2017
In the next few years, chemical executives will need to confront major global challenges—political, economic, and ecological—along with a secular slowdown in growth. Opportunities and risks will emerge from unexpected short-term volatility more often than from long-term trends. In addition, pressure from activist investors will increase in the new normal of low returns.
Shaping the portfolio will therefore be an enormous challenge, perhaps greater in chemicals than in any other industry. Balancing the key tradeoffs of resilience versus coherence and refraining from simplistic solutions will remain essential tasks for executives going forward. Creating value may come less from large-scale portfolio shifts than from granular and constant efforts to elevate functions and operations to a higher level of capability, along with a strong emphasis on the opportunities that digitalization offers to every function and operation.
Shifting the business to the most advantageous positions and deploying the full opportunities of customer-centric business models will require a readiness to challenge the approaches and rules of the past, and the ability to adjust more rapidly than the competition. These will be the primary differentiating traits of value creation champions in the years to come.
